In the latest of our quarterly updates, we use our unique, national dataset to provide a comprehensive view of the key trends in the independent healthcare sector up to, and including, the end of 2024.
At a glance
Changes from 2023 to 2024:
- Reported private hospital/clinic admissions were up 3% across the UK.
- Private medical insurance admissions were up 6% to new record level.
- Self-pay admissions were down 3% but still at third highest annual total.
- Fourth consecutive year of growth in total and insured admissions.
Changes from 2019 (pre-pandemic) to 2024:
- Private admissions up 20% across the UK.
- Insured admissions up 14% and self-pay up 38%.
%20.png)
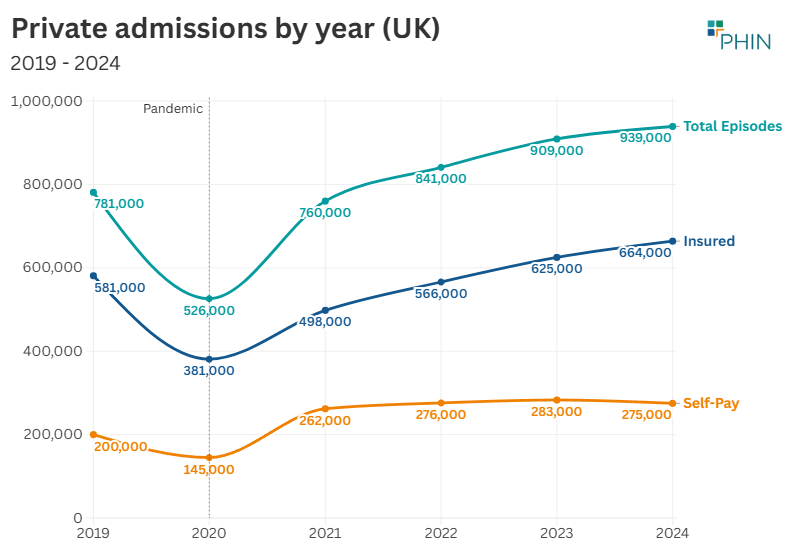
Record independent healthcare in-patient admissions in 2024
The total number of admissions in 2024 was 939,000 (3% above 2023) meaning the private sector had more admissions than in any previous year on record for the third year in a row.
Each quarter in 2024 had a record number of admissions compared to the equivalent period in previous years.
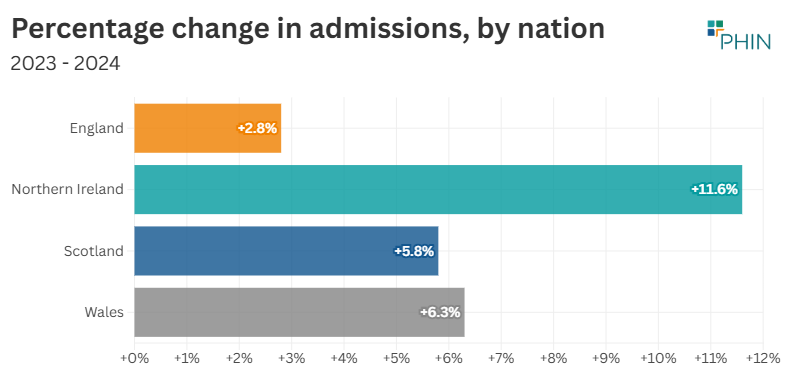
In 2024, the number of admissions rose in Northern Ireland by 12% (+2,500), the highest percentage increase of any nation. Admissions in Wales (+1,900) and Scotland (+2,700) both increased by 6%.
Although it had the lowest increase in admissions by percentage (3%), England had the largest increase by volume (+22,900).
Private medical insurance funded admissions driving growth, but self-pay funded admissions still high
Insured admissions
Three of the highest quarters for admissions paid for with private medical insurance occurred in 2024, contributing to the record annual figure.
There were 39,000 more insured admissions than in 2023 (6% increase).
Compared to 2023, the number of admissions using private medical insurance rose in all English regions, as well as in Scotland (11%), Wales (9%) and Northern Ireland (29%).
Northern Ireland’s percentage increase was the largest of any nation or English region. The biggest rises for insured admissions in England came in the East Midlands (9%) and London (8%).
The largest rises by volume were in London (18,300) and Northern Ireland (3,200) followed by the East of England (3,000).
.png)
Self-pay admissions
Self-pay admissions in 2024 were down by 8,000 (-3%) compared to 2023. This was despite Q1 2024 being the highest ever quarter for self-pay admissions at over 73,000.
At 275,000 admissions, 2024 is third highest year for self-pay admissions, behind 2023 (283,000) and 2022 (276,000).
In 2024, admissions financed by ‘self-pay’ fell in every English region, except London compared to 2023 levels. They also fell in Scotland and Northern Ireland.
The biggest percentage and volume fall in England came in the East of England (-9%) and the South West (-9%).
.png)
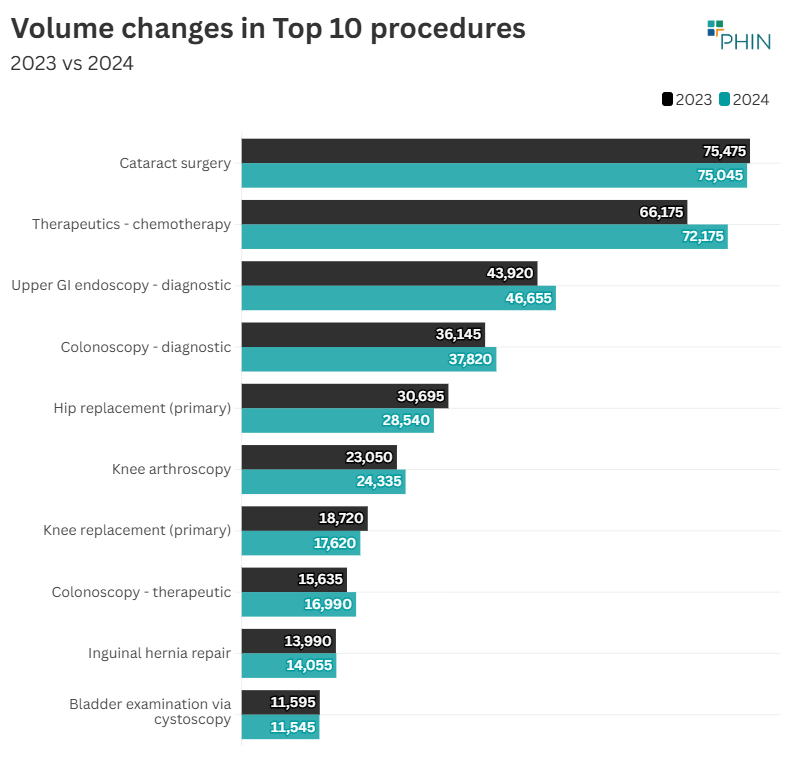
Top 10 procedures UK
The biggest increases by volume in admissions in the Top 10 procedures were for ‘Therapeutics – chemotherapy’. These increased by 6,000 (9%), but it is worth noting that patients usually require multiple admissions for this treatment and the number of admissions they have varies depending on their health. The next biggest volume increase was in ‘Upper GI endoscopy – diagnostic’ at 2,735 (9%).
The biggest decrease was in ‘Hip replacement (primary) which was down 2,155 (7%). ‘Knee replacements (primary)’ were also down (6%). These two replacements are mainstays of the private sector Top 10 and conventionally form the top 3 with ‘Cataract surgery’.
This year PHIN has begun reporting on the traditional form of these procedures and the robot-assisted version separately. ‘Hip replacement (primary) – robotic assisted’ increased by 44% and ‘Knee replacement (primary) – robotic assisted’ by 51%.
Although the assisted procedures are currently conducted at lower volumes than the standard method, this is changing and we would expect them to continue to increase and overtake the traditional method in time.
Market trends from 2023 to 2024
When looking beyond the Top 10 procedures, there was a 21% increase in ‘Surgical treatment for endometriosis’ but a fall (-21%) in ‘Weight loss surgery – gastrectomy’.
Three types of cosmetic surgeries – ‘Tummy tuck – abdominoplasty’ (-10%), ‘Breast lift – mastopexy’ (-15%) and Breast reduction (-7%) – were also down.
The reduction in cosmetic surgery – which is nearly always paid for by self-pay – has been a pattern for the year and could be related to the cost-of-living crisis or changing fashions.
.png)
%20%C3%A2%C2%80%C2%93%20Insurance%20funded.png)
%20%C3%A2%C2%80%C2%93%20Self%20Pay%20funded.png)
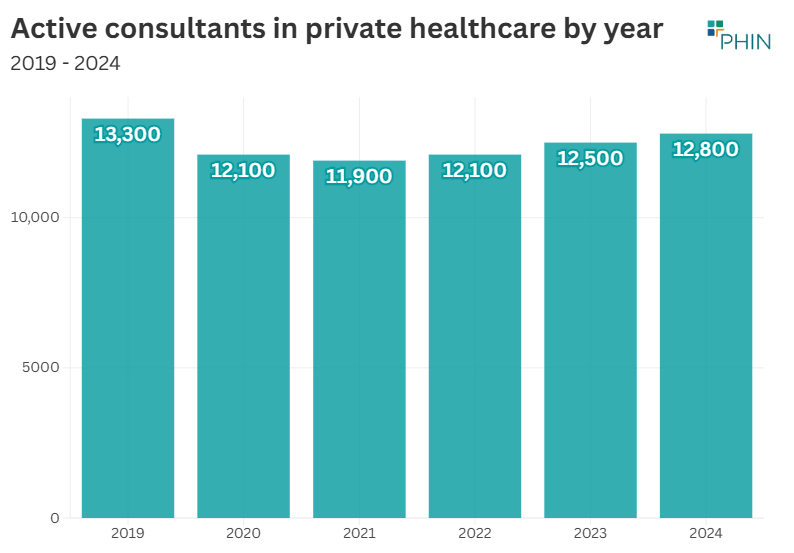
The number of consultants active in private healthcare regularly fluctuates as new consultants start working in the private sector, and existing ones go on sabbatical, stop working privately, or retire. The number of active consultants was at the highest level since the pandemic in 2024.
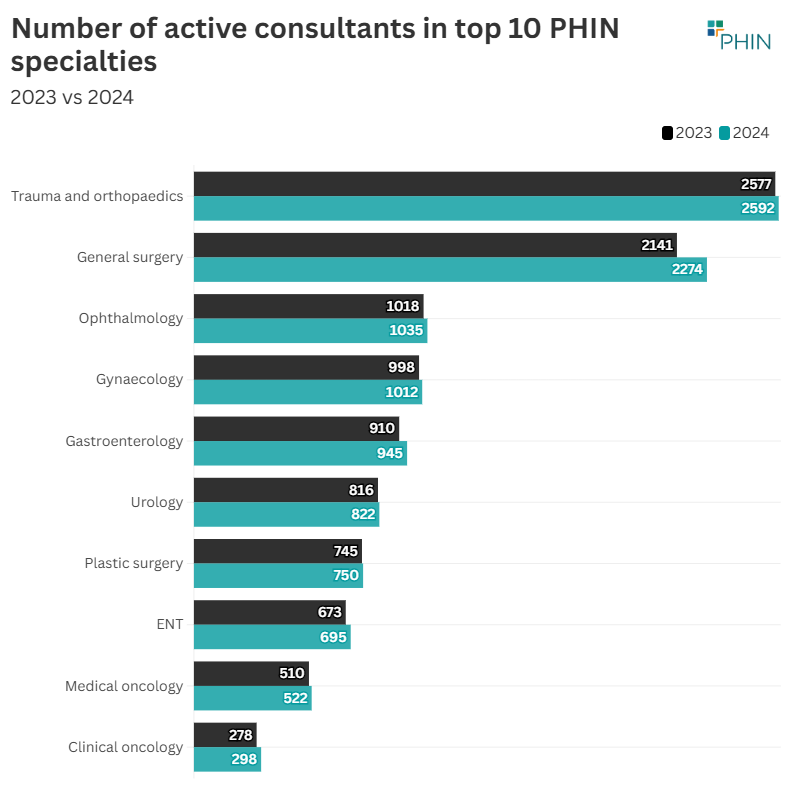
The largest volume and percentage increase in active consultants in the top 10 procedure groups in 2024 was in ‘General Surgery’ with an extra 133 consultants (6%).
Gastroenterology had the next biggest increase with an extra 35 consultants (4%).
Patient demographics
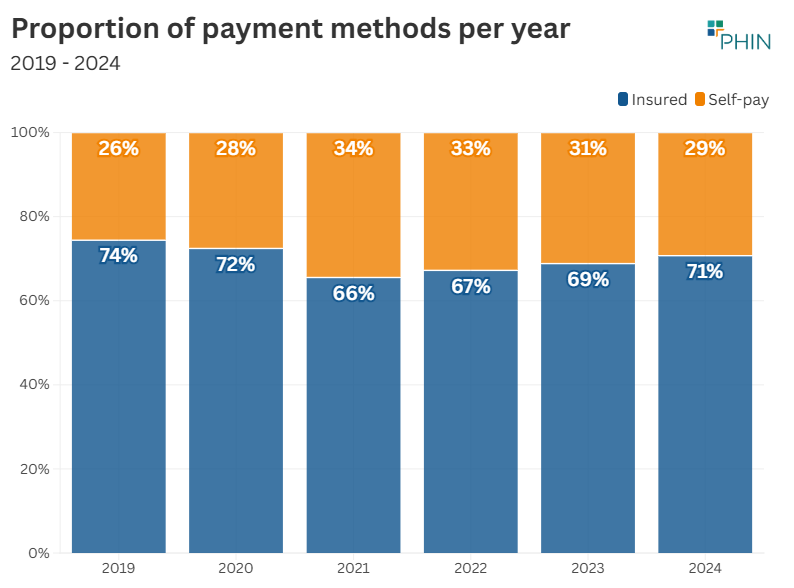
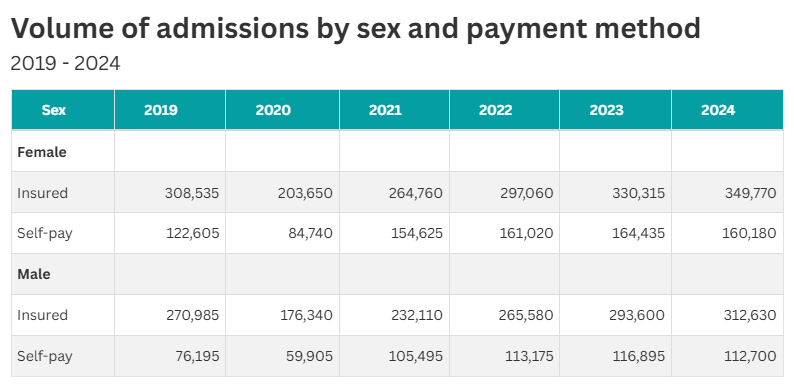
Payment method
There was an increased number of insured admissions for both sexes in 2024 compared to 2023. Female insured funded admissions increased 6% and male admissions 7%.
Female self-pay funded admissions fell 3% and male admissions were down 4%.
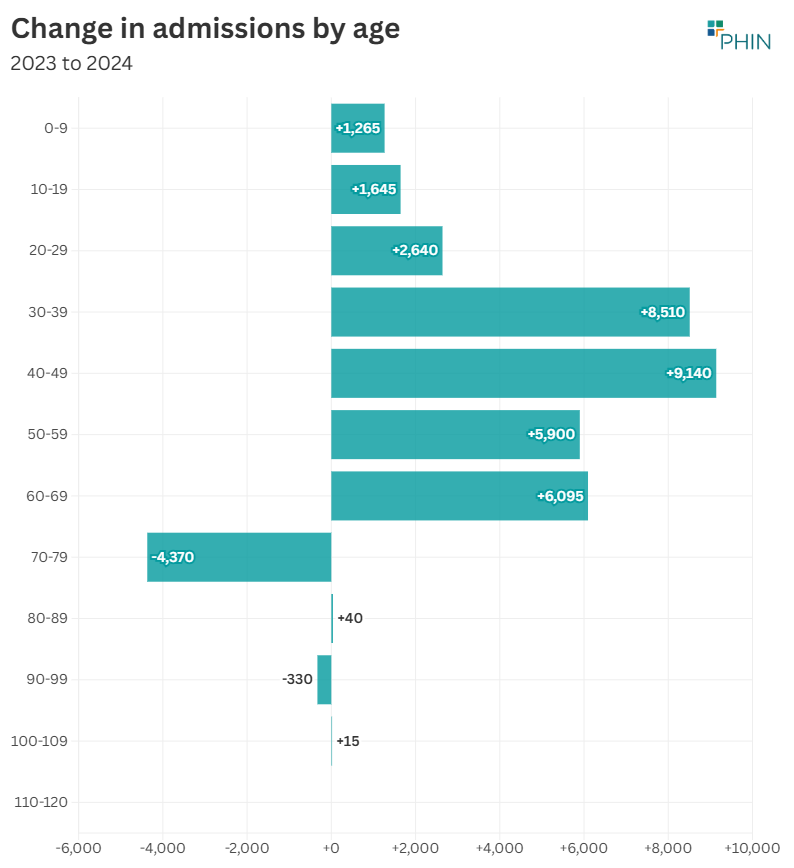
Volume of admissions by age
There was an increase in admissions in all age groups up to 70, and from 100 to 109, in 2024 compared to the previous year. The largest volume increase was in the 40 to 49 age group (9,140) followed by the 30 to 39 age group (8,510). The largest percentage increase was in the 100-109 (30%) age group.
Private healthcare as proportion of English admissions
Despite being a record year for private hospital/clinic admissions, the proportion of the total day-case/in-patient admissions conducted in the UK reduced slightly.
The percentage of admissions funded by the NHS, but conducted in private hospitals/clinics, has remained consistent over the past eight years, with a slight dip in 2020.
The percentage of admissions in the NHS was the highest since the pandemic in 2024, but still slightly lower than pre-pandemic levels.
Important notes
All data described above is taken from PHIN’s unique, national private dataset describing discharge activity (day case and inpatient). This excludes activity outside of PHIN’s mandate from the Competition and Markets Authority, such as outpatient diagnostics, physiotherapy and mental health services.
There is a time lag between collecting, validating and processing the data we receive from hospitals before we can publish it. This can be up to 6 months after treatment has been completed, to ensure a fair process and accurate data.
Activity numbers have been rounded to the nearest 5, with percentage based on the unrounded figures.