Since we last reported on the impact Covid-19 has had on the private healthcare market in the UK, we’ve seen a steady increase in activity as the sector rebounds.
Private treatment is back to almost 50% of last year
Estimated count of private episodes
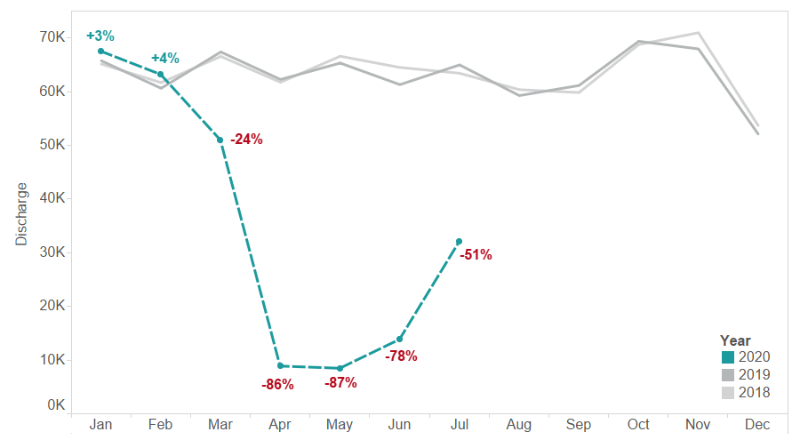
Here we can see total admissions [1] of private patient care for 2018 and 2019, alongside estimated 2020 episodes.[2] After a dramatic fall in privately funded patient care in April and May – when the country was in lockdown, June and July have seen a steady increase, with July seeing an estimate 32,000 private admissions. This is about half of 2019 activity, but up significantly from 8,400 in May this year.
Private admissions by specialty
When looking at episodes by consultant specialty, we can see the make-up of private healthcare has changed dramatically during the pandemic but is showing signs of returning to previous levels.
Private activity by specialty as % admissions
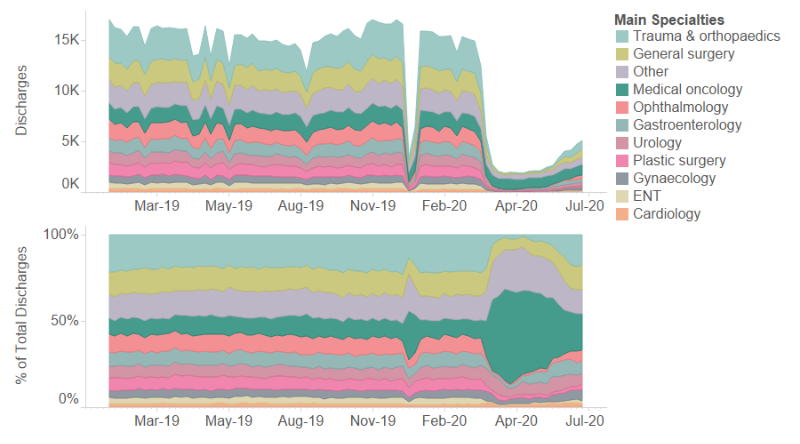
The top graph shows all private admission split by specialty. Here we can see the dramatic drop-off in activity in April is starting to return in July.
During the pandemic there was a continuing baseline of urgent activity, such as medical oncology. In the bottom graph we can see market share by consultant specialty, with medical oncology commanding a significant proportion of the market in May and April. Whilst volume has increased, medical oncology as a percentage of market share has fallen as specialties such as trauma and orthopaedics begin to restart. [3]
Medical oncology – estimated admissions and market share
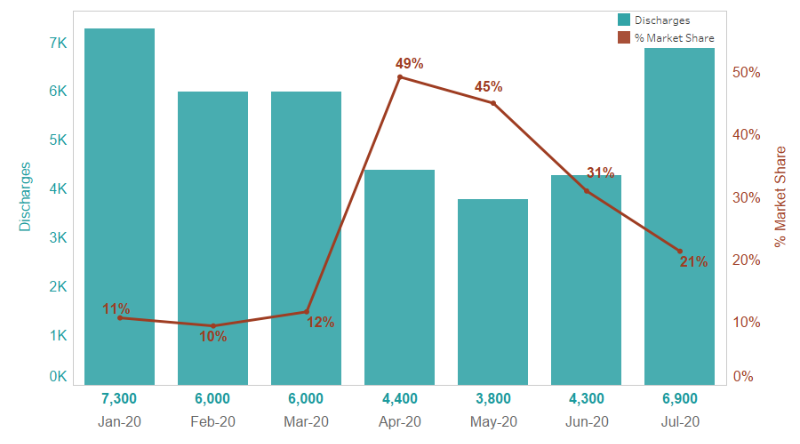
Taking a more detailed look at some consultant specialties, medical oncology (above) has grown from a relative low of 3,800 in May to an estimated 6,900 in July, maintaining its position as the most common specialty with 21% of market share by activity. This is around twice its market share in January – which was 11% and 7,300 admissions. Overall, medical oncology is largely back to pre-Covid levels, dropping 5% from 7,300 admissions in January to 6,900 in July.
Trauma and Orthopaedics – estimated admission and market share
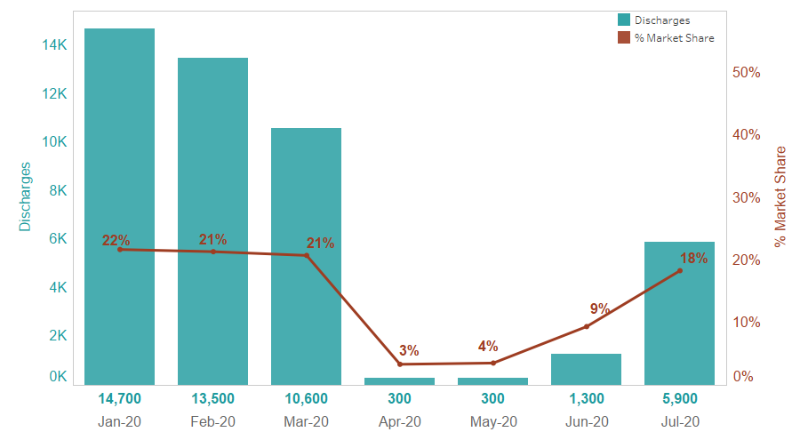
Trauma and orthopaedics has seen the largest recovery, with discharged up to an estimated 5,600 in July from a low of 300 in May. However, this is still significantly down on activity pre-Covid, with a 60% drop in admissions from January, which totalled 14,700.
Elsewhere, plastic surgery has been one of the specialties slowest to recover. While it has grown from 200 admissions in May to an estimated 800 in July, it remains over 80% down on January. This may not be too surprising as plastic surgery will include a significant amount of cosmetic activity.
In Cardiology, where many procedures are traditionally low volume but high complexity, activity in July is back up to over 60% of what it was in January, having gone from an estimated 1,200 admissions in January, down to only 100 in May and recovering to 800 in July.
The interactive report below allows you to see estimated volumes and market share for each of the 10 most common specialties in private healthcare for 2020.
Interactive graph: Estimated admission and market share, 2020
Moving consultations online
We noticed that many consultants started offering remote consultations during the Covid-19 crisis and so we now allow consultants to add this information to their consultations information on the PHIN website. Following this, we’ve now surveyed hospitals to find out to what extent they are providing clinics remotely.
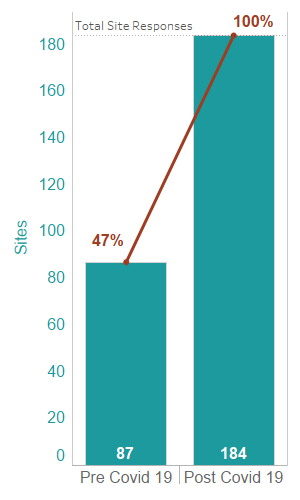
In a survey of 184 hospitals [4] treating private patients, only 87 (47%) offered online or telephone consultations prior to the Covid-19 pandemic. This number has significantly increased, with all 184 hospitals survey now stating that they offer telephone or online consultations for patients. While this is unlikely to be the true percentage, with a large number of small independent clinics and NHS Private Patients Units that didn’t respond to the survey unlikely to yet be offering remote consultations, this still represents a significant uplift in the use of technology to facilitate patient conversations with their consultants.
Survey responses
Summary
This data does not take account of Covid-19 care or NHS patients treated in independent hospitals NHS Private Patient Units during the pandemic, and is not yet complete. Therefore it can’t give a full picture of what is happening across healthcare. However, we can see how the private healthcare market is beginning to emerge from the Covid-19 pandemic.
Certain specialties such as cardiology and trauma and orthopaedics are slowly returning to pre-covid levels, and overall the makeup of the market is beginning to return to normal. However, specialties such as plastic surgery are understandably seeing a much slower recovery as people remain cautious.
Elsewhere, private healthcare’s offer is also changing, using technology to offer online and telephone consultations in much greater numbers than before.
Footnotes
[1] Admissions are counted as the number of hospital stays that have been completed within our reporting period.
[2] YoY change are calculated using sites with confirmed volumes for 2020 and 2019 for each month, removing influence of delay in private data submissions due to Coronavirus. 2020 volumes are estimated based on sites with confirmed activity. Estimates assume these sites are representative of the entire market, with confidence varying depending on number of submitting sites.
Typical sites submitting per month: 400
- January 2020: 242 Sites
- Feb 2020: 233 Sites
- March 2020: 215 Sites
- April 2020: 131 Sites
- May 2020: 129 Sites
- June 2020: 114 Sites
- July 2020: 122 Sites
To download the estimated admissions (counted at discharge data) and market share for Jan – July 2020, please contact press@phin.org.uk
[3] Recent share is based upon only sites that have submitted data more recently, however the make-up of these providers is generally representative of the entire market. Whilst medical oncology represents a greater proportion of activity than seen historically, this may be influenced by larger variations caused by smaller number of discharges. All data, statistics and graphs ©PHIN 2020, all rights reserved. The accuracy of information presented is dependent on the completeness and quality of data supplied by private hospital operators, and may be corrected or updated in future. PHIN accepts no liability for the accuracy of the information. Not to be reused in whole or in part without permission and attribution to PHIN.
[4] PHIN surveyed all private healthcare providers in the UK, including independent hospitals and NHS PPUs. 184 hospitals responded to the survey, of which only 1 was an NHS PPU.