| At a glance: Wales recorded 7,675 private admissions in Q1 2026. This was 4.7% lower than Q1 2025. Insured admissions rose by 6.3%, while self-pay admissions fell by 13.3%. |
|---|
In the latest of our quarterly updates, we use our unique national dataset to provide a summary of the key trends in the independent healthcare sector, covering data up to and including Q1 2026.
Key findings
- Total activity: 7,675 admissions, down 380 year on year and the lowest quarterly level since Q3 2024.
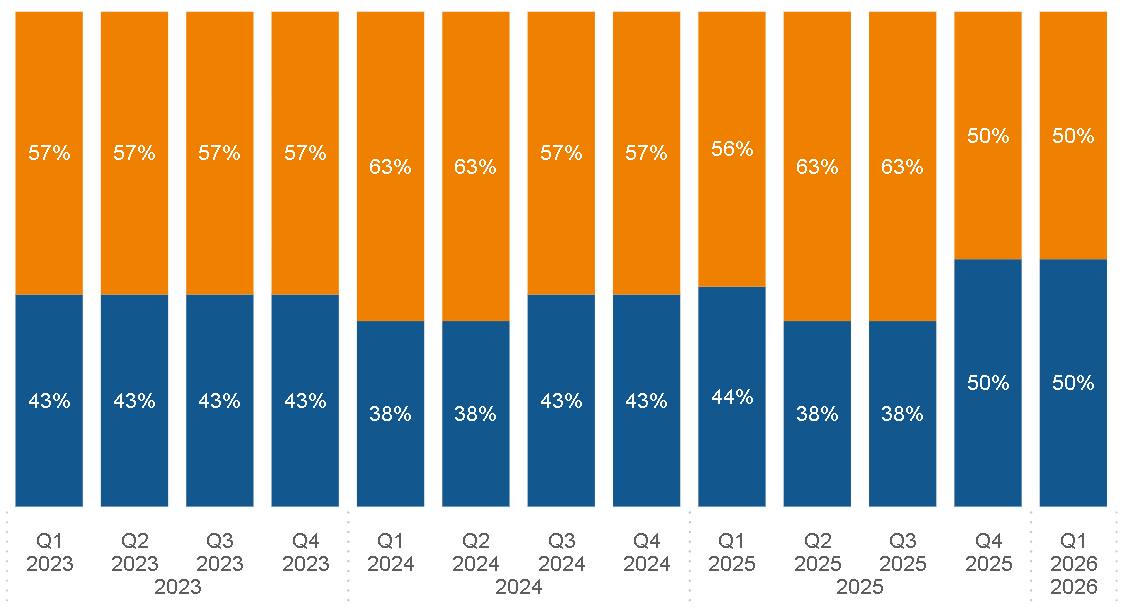
- Funding: nearly equal split between self-pay and insurance admissions.
- Insurance: admissions reached a record total of 3,740, an increase of 220.
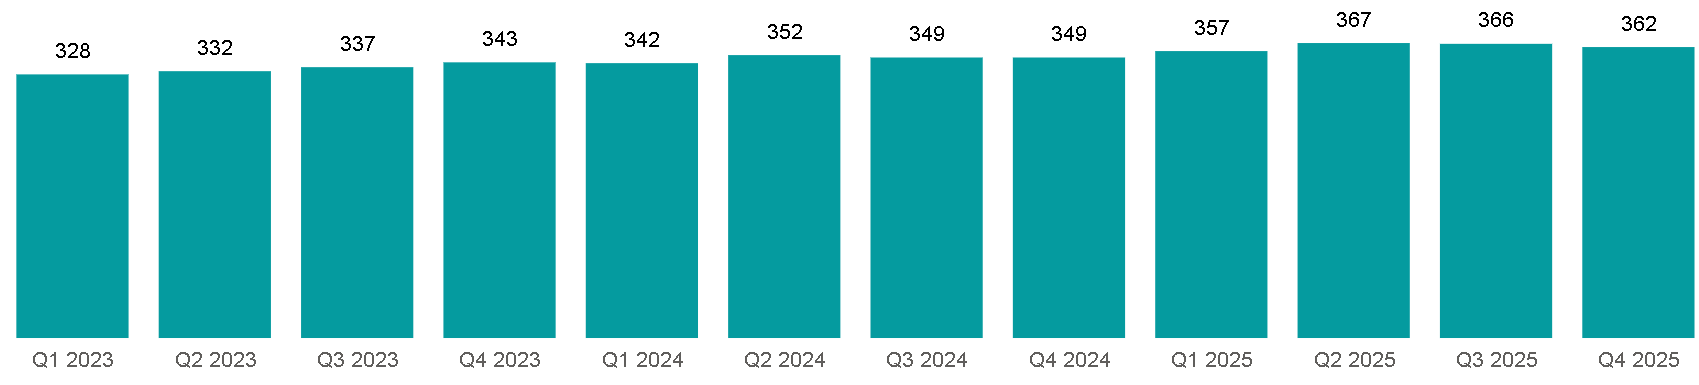
- Consultants: 379 consultants were active, 22 more than in Q1 2025 and the highest quarterly total ever.
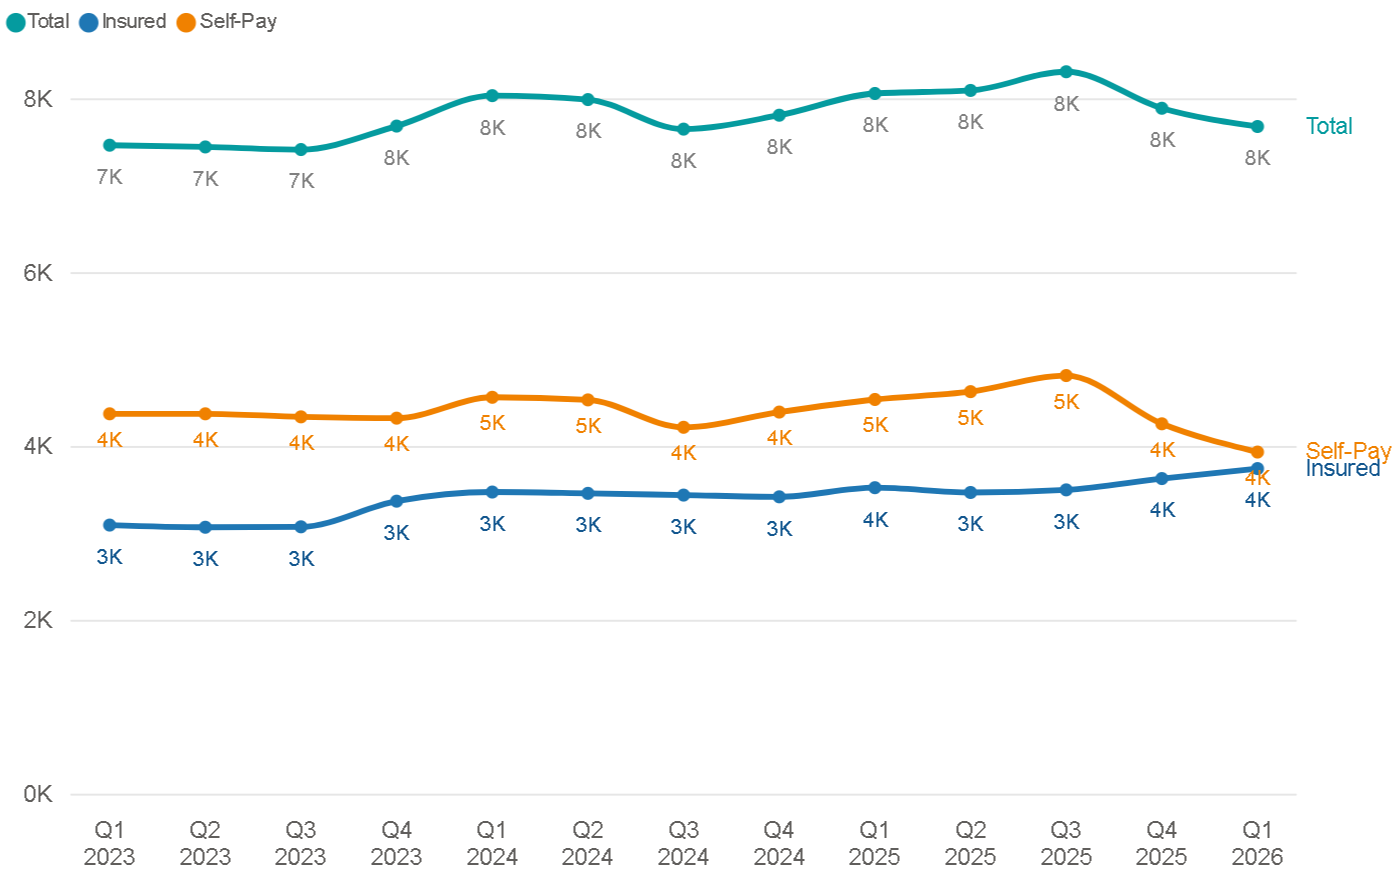
Admissions remained high, with insured activity increasing
Wales recorded 7,675 admissions in Q1 2026, down 4.7% from Q1 2025. Across the UK, admissions also fell in Scotland (1.4%) and Northern Ireland (8.0%) but rose in England (0.9%).
Different trends by payment method
- Insured admissions: up 6.3% to set a new record.
- Self-pay admissions: down 13.3% to 3,930, the lowest total since Q3 2022.
- Payment mix (with rounding) : 50% insured and 50% self-pay.
| Context: UK self-pay admissions increased by 7.7% compared with Q1 2025. Scotland increased by 6.6%, Northern Ireland by 4.2% and England by 9.5%; Wales fell by 13.3%. |
|---|
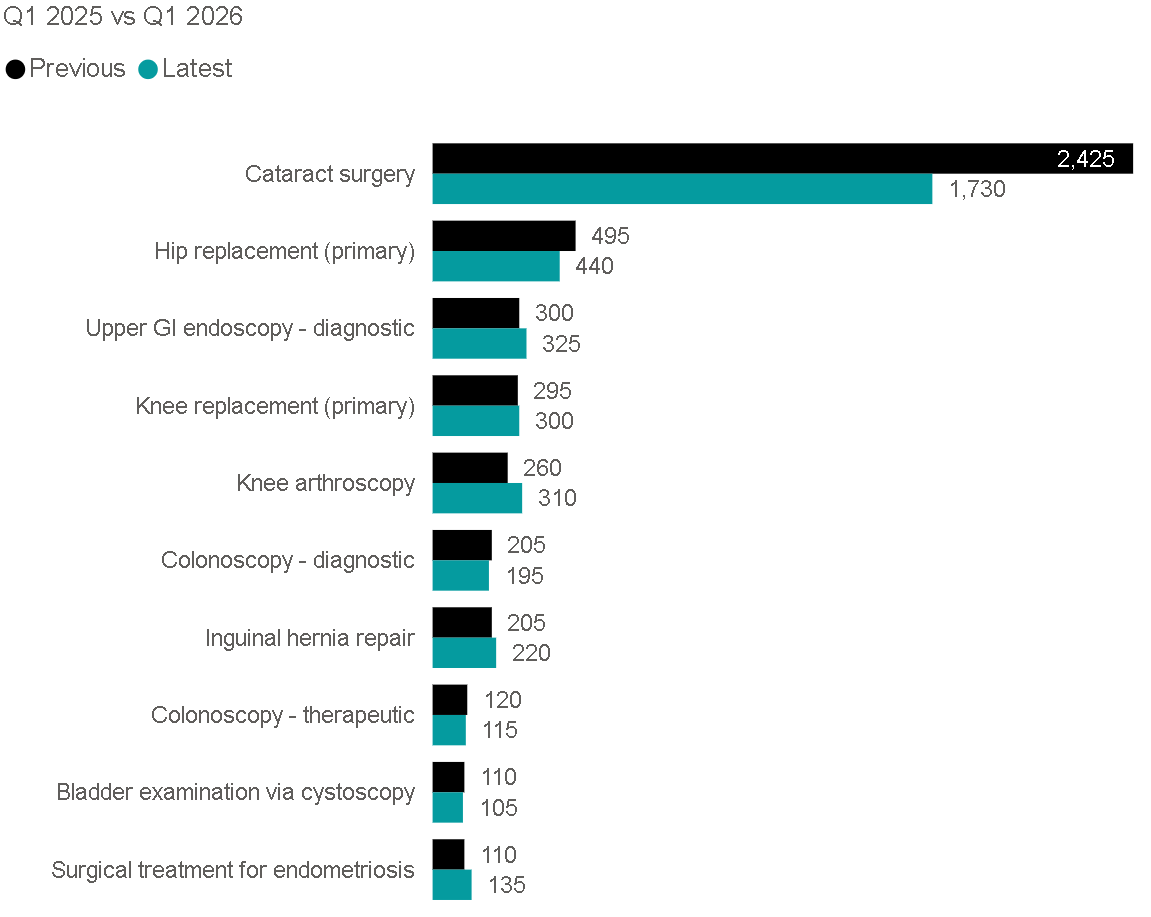
Five of the 10 highest-volume procedures decreased
Comparing Q1 2025 with Q1 2026, admissions fell for five of Wales’ 10 highest-volume procedures.
- Largest decrease: cataract surgery fell by 695 admissions, or 29%.
- Largest increase: knee arthroscopy rose by 50 admissions, or 19%.
- Outside the top 10: eyelid lift blepharoplasty increased by 70 admissions, or 140%.
Consultant activity eased
There were 379 active consultants in Q1 2026, 6.2% more than in Q1 2025. There were increases in the number of consultants working in General surgery, Ophthalmology, Gynaecology, Urology, Gastroenterology and plastic surgery among the top specialties; the others declined or were unchanged.
Patient profile
- Age: patients aged 70 to 79 accounted for the most admissions, at 1,710, although this was 280 fewer than a year earlier.
- Older age groups: every age group aged 60 and over recorded a decline; the largest was among 70 to 79-year-olds.
- Younger age groups: volumes were lower, but admissions increased for people aged 10 up to 59.
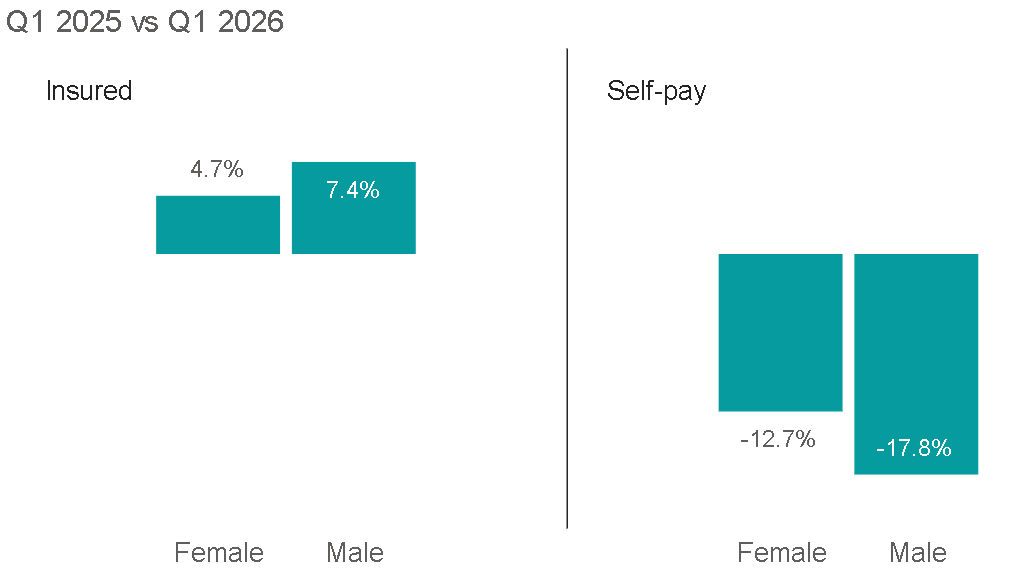
- Sex and funding: insured admissions rose by 4.7% for females and 7.4% for males; self-pay fell by 12.7% and 17.8% respectively.
Important notes
- PHIN’s national dataset covers inpatient and day-case discharge activity. It excludes activity outside PHIN’s mandate under the Competition and Markets Authority Order, including outpatient diagnostics, physiotherapy and mental health services.
- Data is collected, validated and processed before publication. This can create a time lag of up to six months after treatment.
- Late hospital submissions are added to future updates, so figures can change. Use the latest published update.
- Activity numbers are rounded to the nearest five. Percentages are calculated from unrounded figures.
- For historical data before 2023, contact PHIN.
| Scope: private healthcare inpatient and day-case admissions in Wales, with comparison between Q1 2025 and Q1 2026. Q1 covers January to March. |
|---|