In the latest of our quarterly updates, we use our unique national dataset to provide a comprehensive view of the key trends in the independent healthcare sector, covering data up to and including the end of Q1 2026.
The data covers private healthcare in-patient/day-case market activity and includes breakdowns by year for insured cases, ‘self-pay’, nation/English region, Top 10 procedures, demographics and proportion of healthcare admissions compared to NHS England.
(Q1 = Jan – Mar; Q2 = Apr – Jun; Q3 = Jul – Sep; Q4 = Oct – Dec)
Private healthcare sector market activity
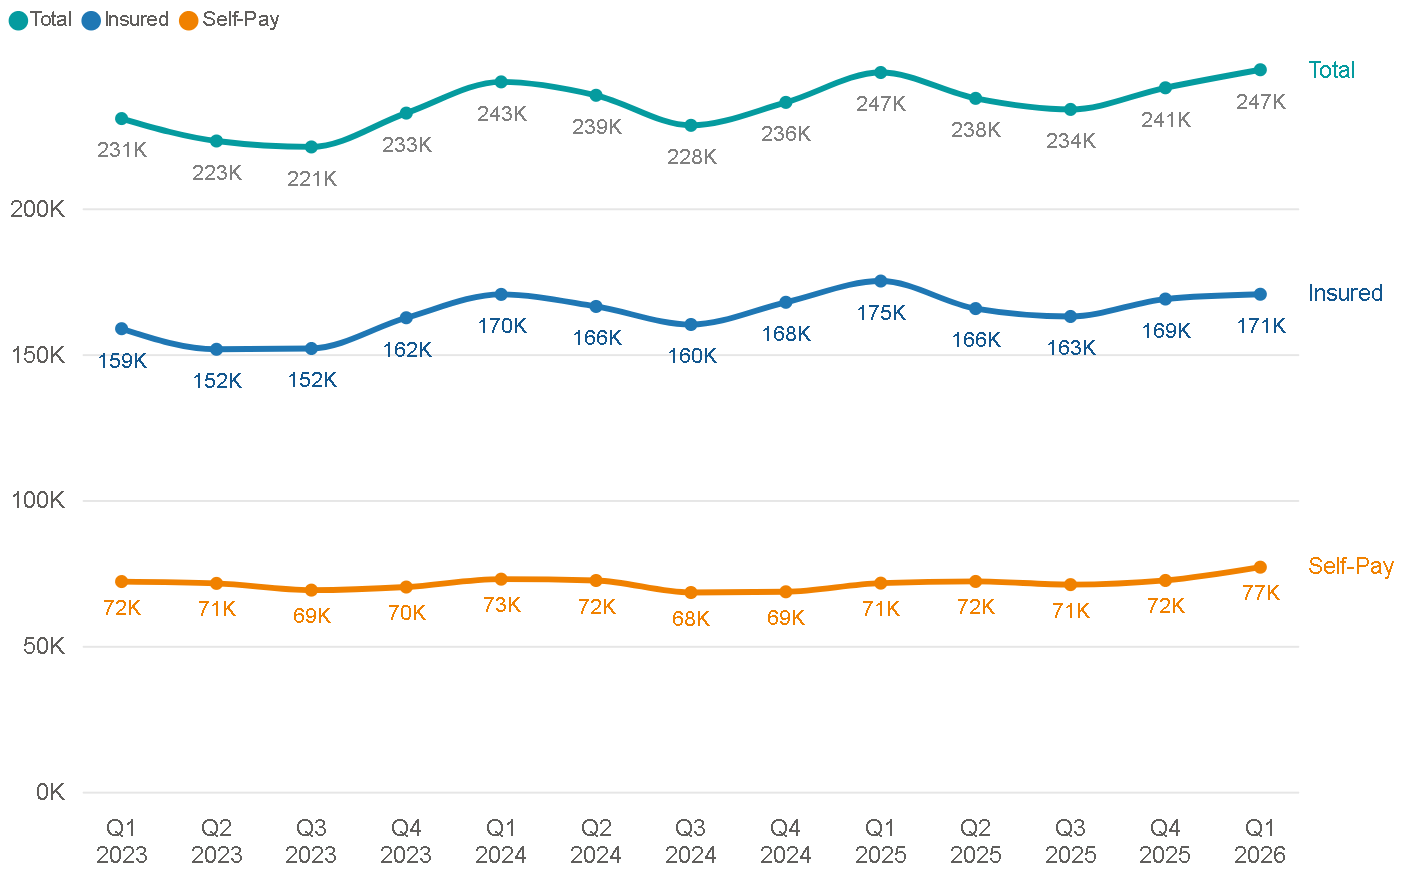
* Figures are rounded to the nearest 1,000. Totals may not add up due to rounding from actual figures.
At a glance
Changes from Q1 2025 to Q1 2026:
- Reported private hospital/clinic admissions were up less than 1% across the UK.
- Private medical insurance admissions decreased by 2.6%.
- Self-pay admissions increased by 7.7%.
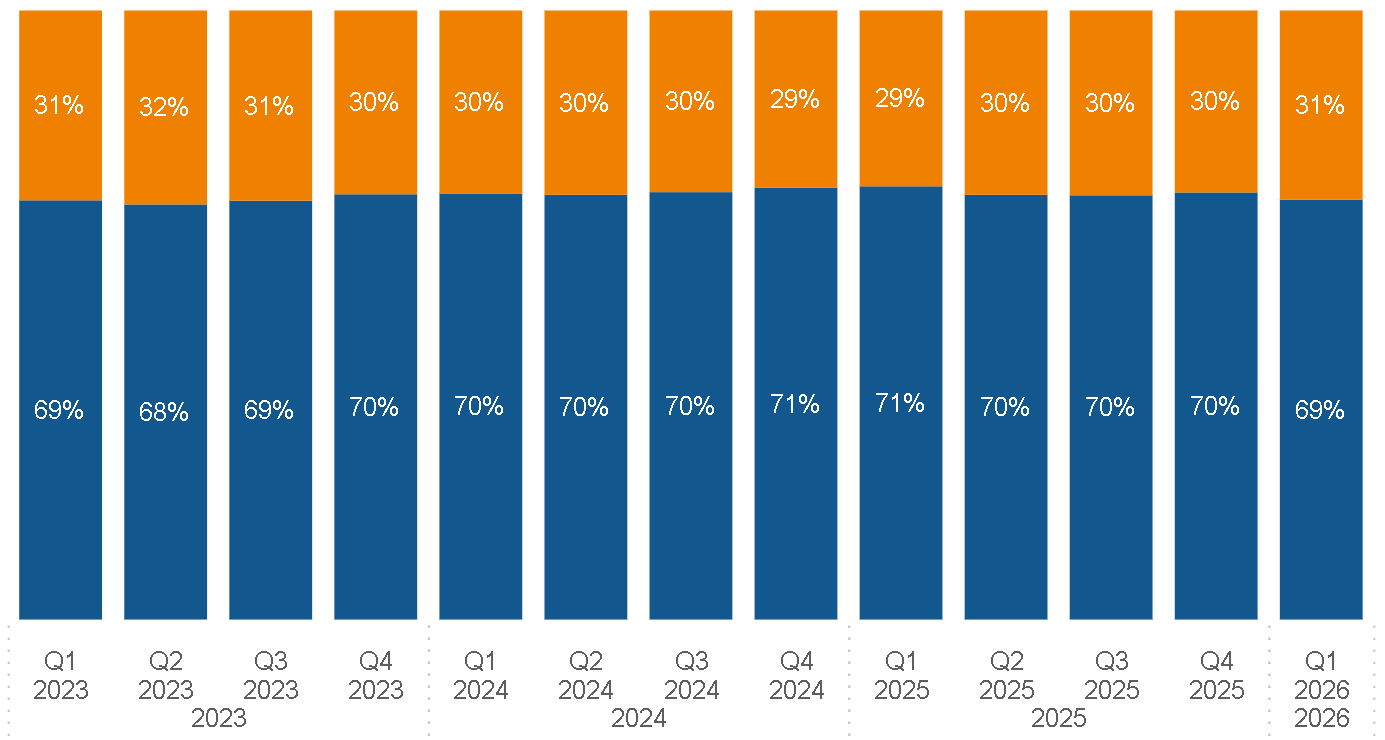
- Funding for admissions was 69% insurance and 31% self-pay.
Private healthcare admissions stable in first quarter of 2026
The total number of admissions in Q1 2026 remained at a high level (247,495). This is an increase of less than 1% compared to Q1 2025 (246,550); which was the previous highest ever quarter for admissions.
There was a slight decline (2.6%) in insured admissions compared to Q1 2025. This was the first time there has been a decline in Q1 insured admissions in the past five years.
By contrast, self-pay admissions, which have remained at a fairly consistent level for the past few years were up 7.7% to reach their highest ever level.
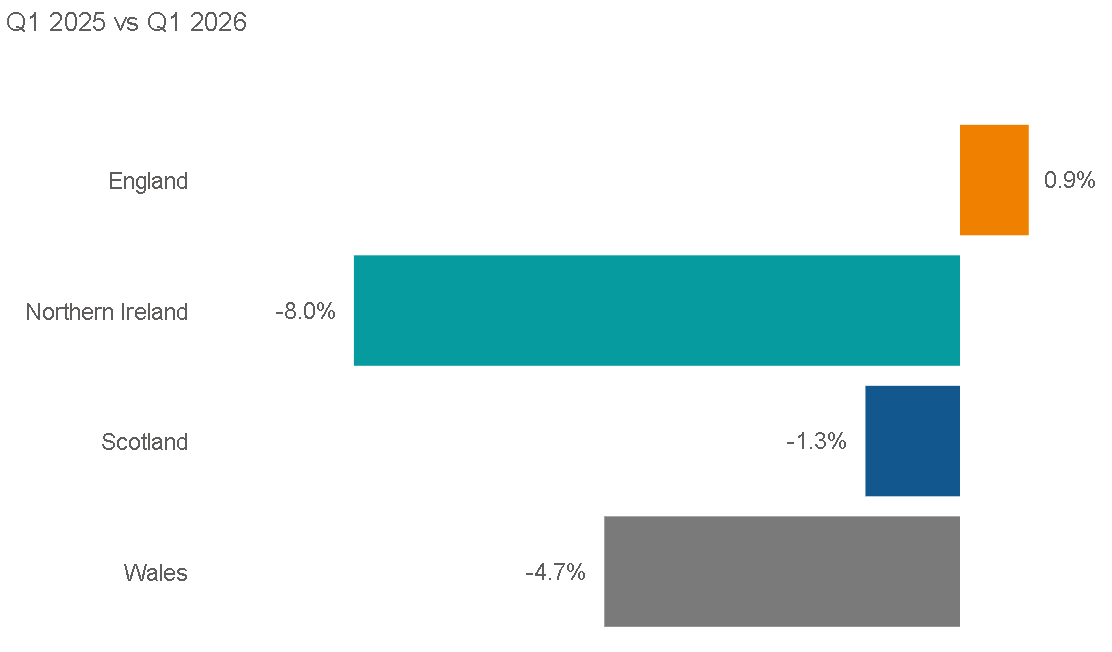
In Q1 2026, total admissions were up in England (0.9%), and down in Scotland (1.3%), Wales (4.7%) and in Northern Ireland (8%).
Private medical insurance funded admissions fall as self-pay admissions rise
Insured admissions
Reported admissions paid for with private medical insurance in Q1 2025 decreased by 2.6% compared to the same period in 2025. There were 4,530 fewer insured admissions than in Q1 2025 across the UK.
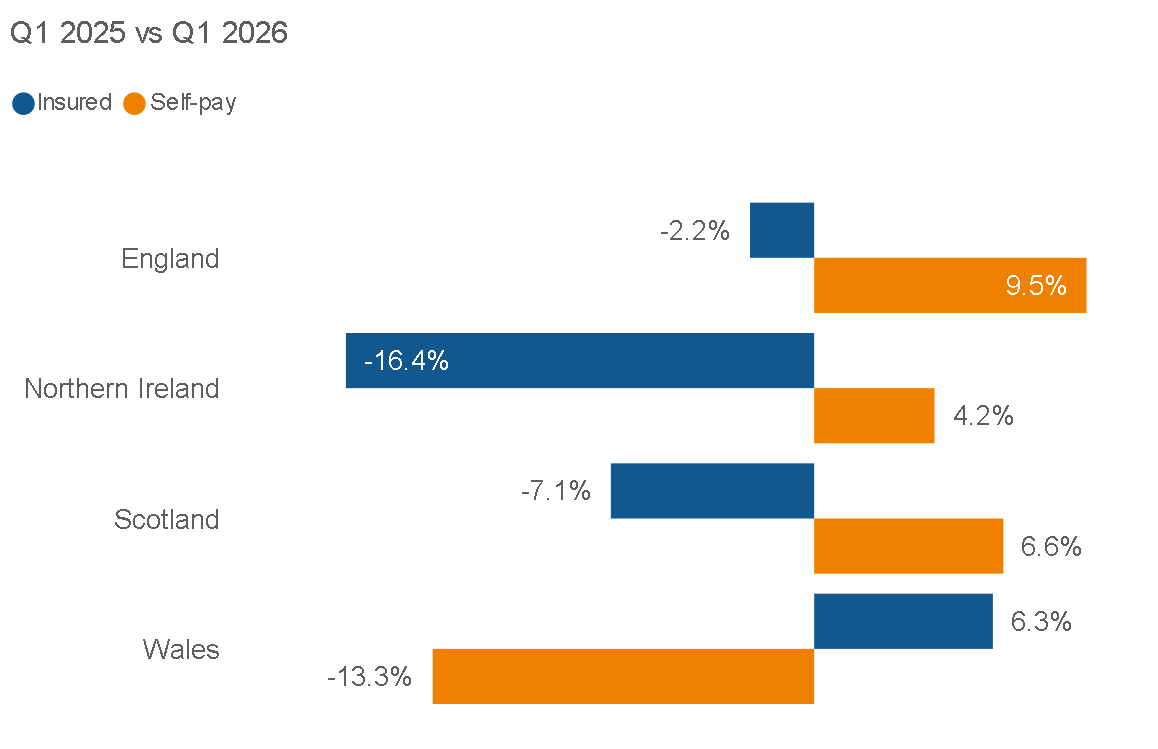
The number of admissions using private medical insurance decreased in England (2.2%), Scotland (7.1%) and Northern Ireland (16.4%), but increased in Wales (6.3%).
Insured admissions increased in five English regions (East of England, North East, North West, West Midlands and Yorkshire and The Humber) and declined in the remaining four (East Midlands, London, South East, South West).
Self-pay admissions
UK self-pay admissions increased by 7.7% in Q1 2026 compared to Q1 2025. They increased in every nation except Wales.
- England: 9.5%
- Scotland: 6.6%
- Northern Ireland: 4.2%
- Wales: -13.3%
Self-pay increased in every English region.
The number of self-pay admissions fell in the remaining English regions.
The proportion of admissions funded with self-pay in the UK increased slightly, but insurance remains the dominant funding method.
Top 10 procedures UK
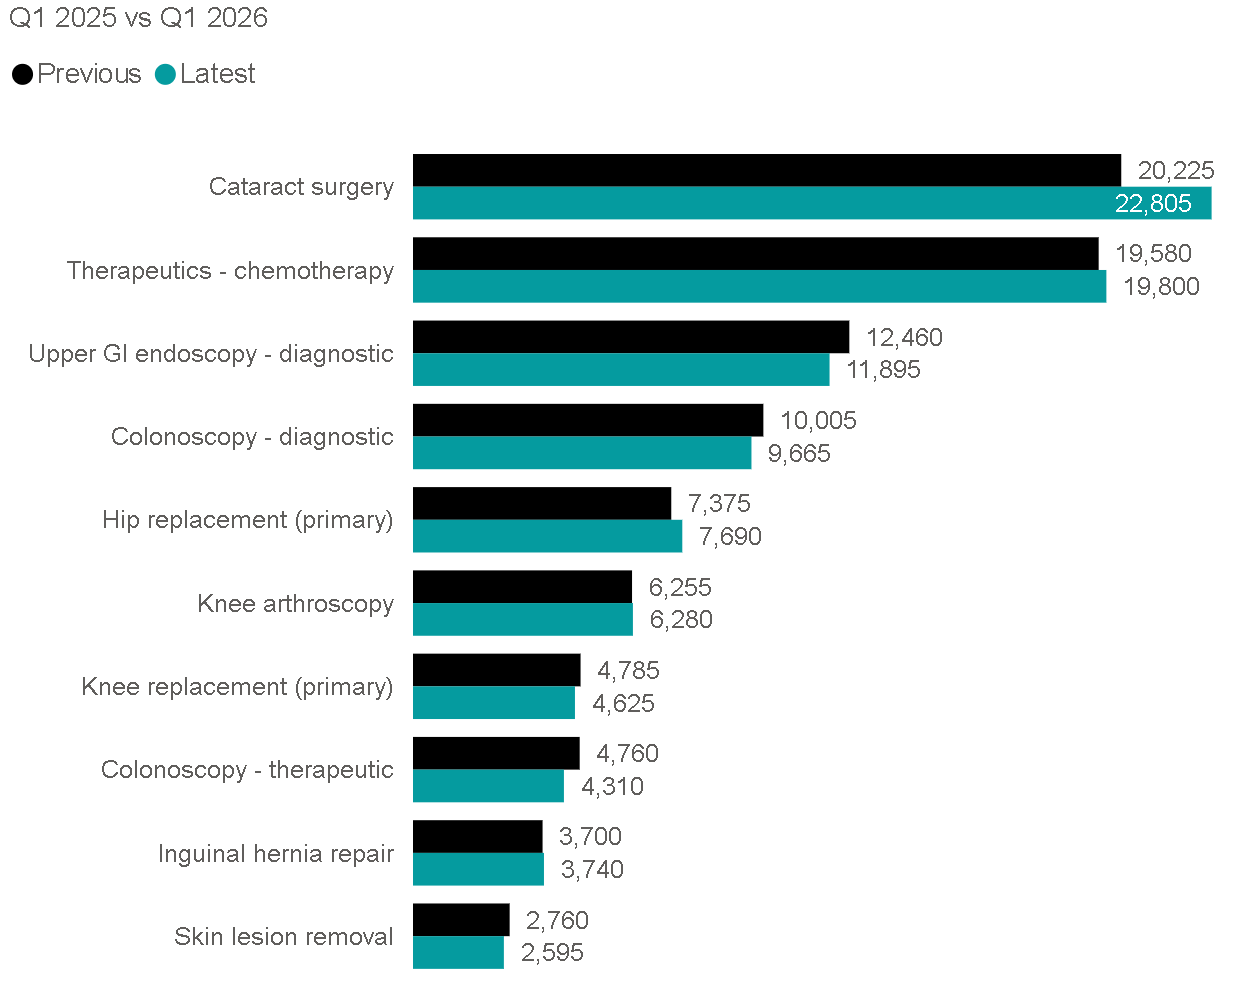
There was a reduction in admissions for five of the Top 10 procedures by volume when comparing Q1 2025 to Q1 2026.
Admissions for ‘Cataract surgery’ increased the most (12.8%) with 22,805 admissions. There were also increases for ‘Therapeutics – chemotherapy’ (1.1%), ‘Hip replacement (primary)’ (4.2%), ‘Knee arthroscopy’ (0.4%) and ‘Inguinal hernia repair’ (1.1%).
‘Upper GI endoscopy’ with 11,895 admissions (-4.5%) and ‘Colonoscopy therapeutic’ with 4,310 (-9.5%) had the two of the largest declines.
Other market trends from Q1 2025 to Q1 2026
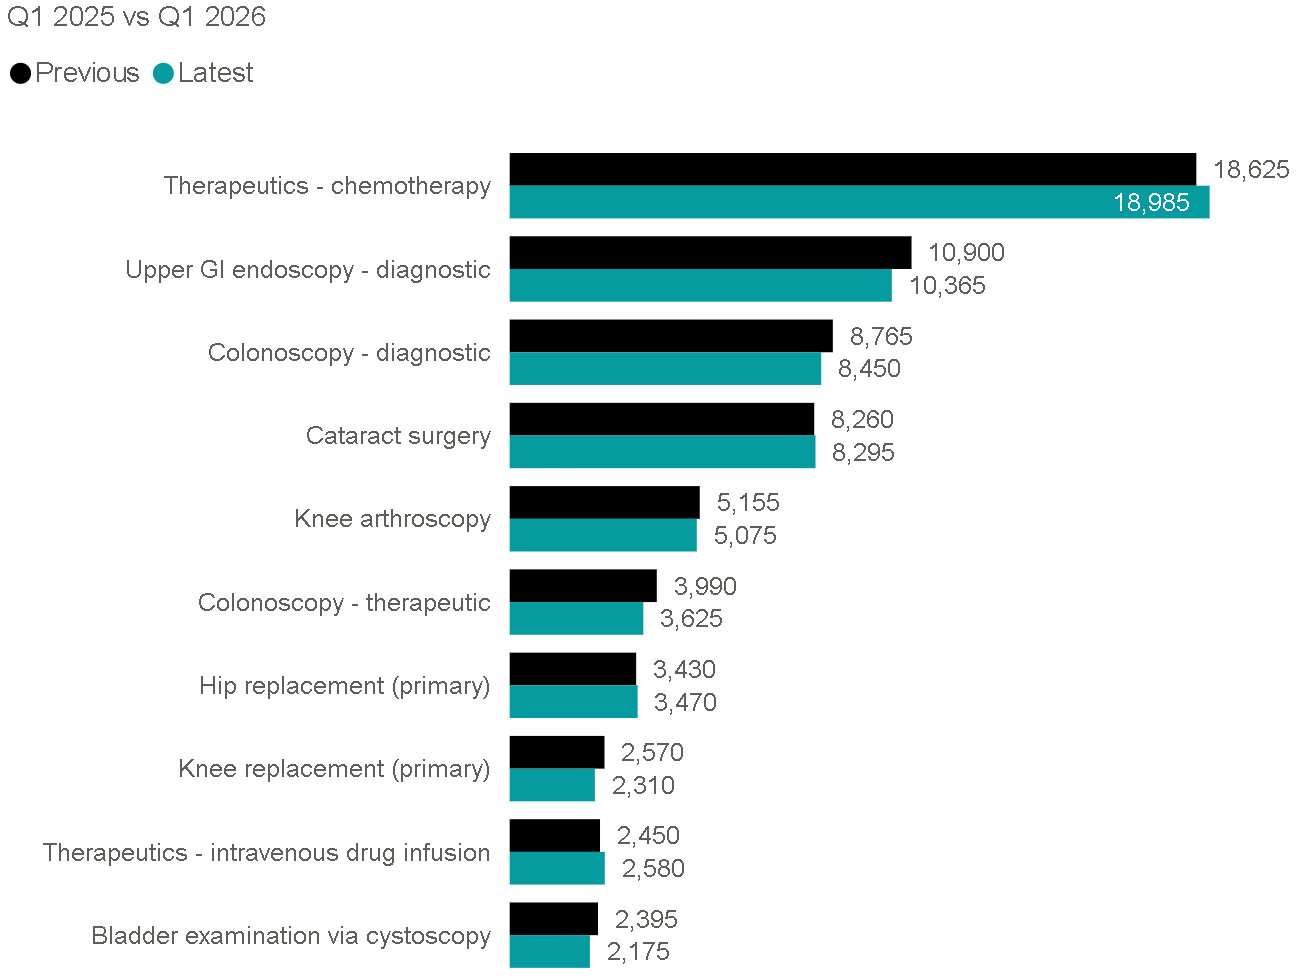
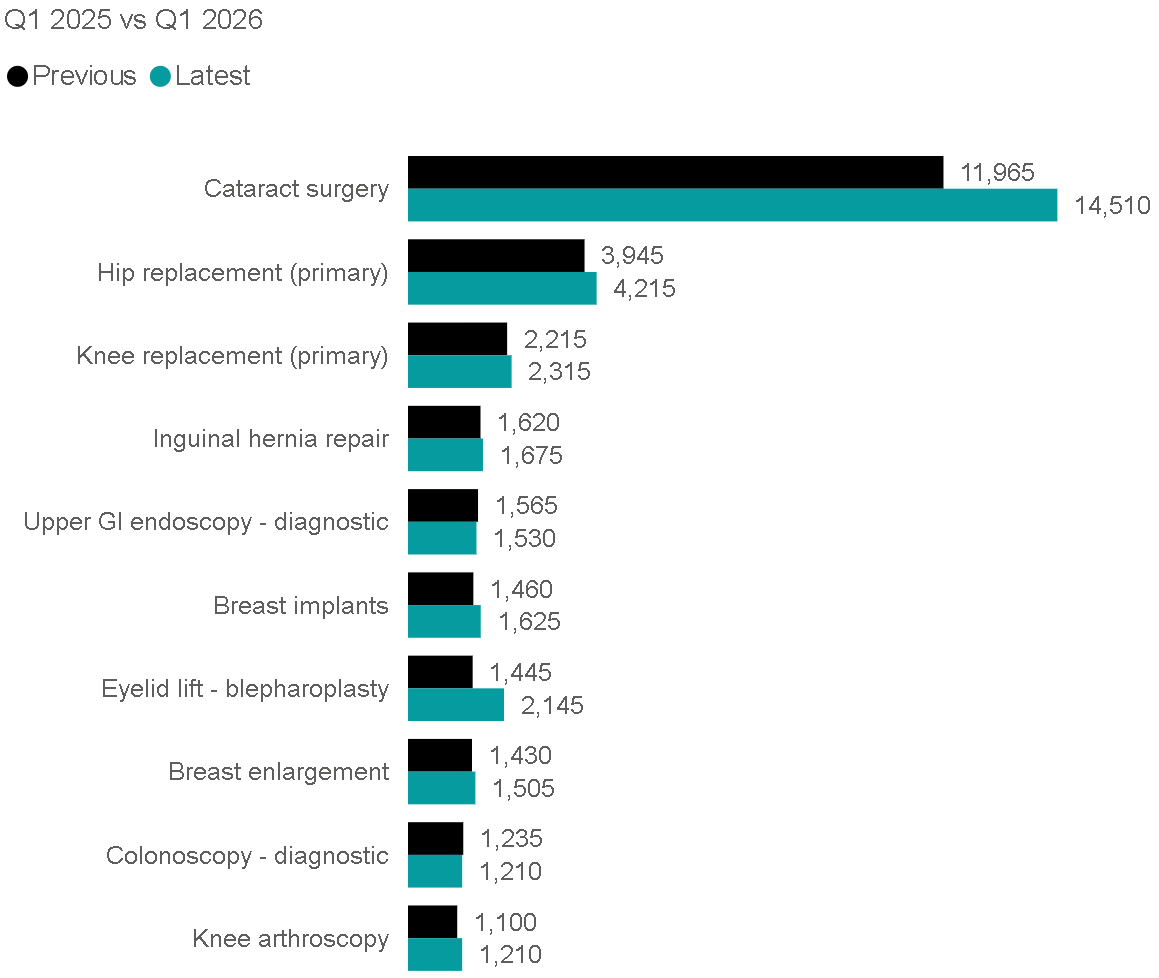
When looking beyond the Top 10 procedures for both payment methods, there was a 43% increase in ‘Eyelid lift - blepharoplasty’, and a 45% increase in ‘Breast lift - mastopexy’.
Weight loss surgeries continued to decline in popularity with both ‘Gastrectomy’ (-49%) and ‘Gastric balloon (-79%) down. ‘Eyelid reconstruction’ (-82%) and ‘Allergy testing’ (-87%) also saw a sharp declines in admissions.
Active consultants in private healthcare
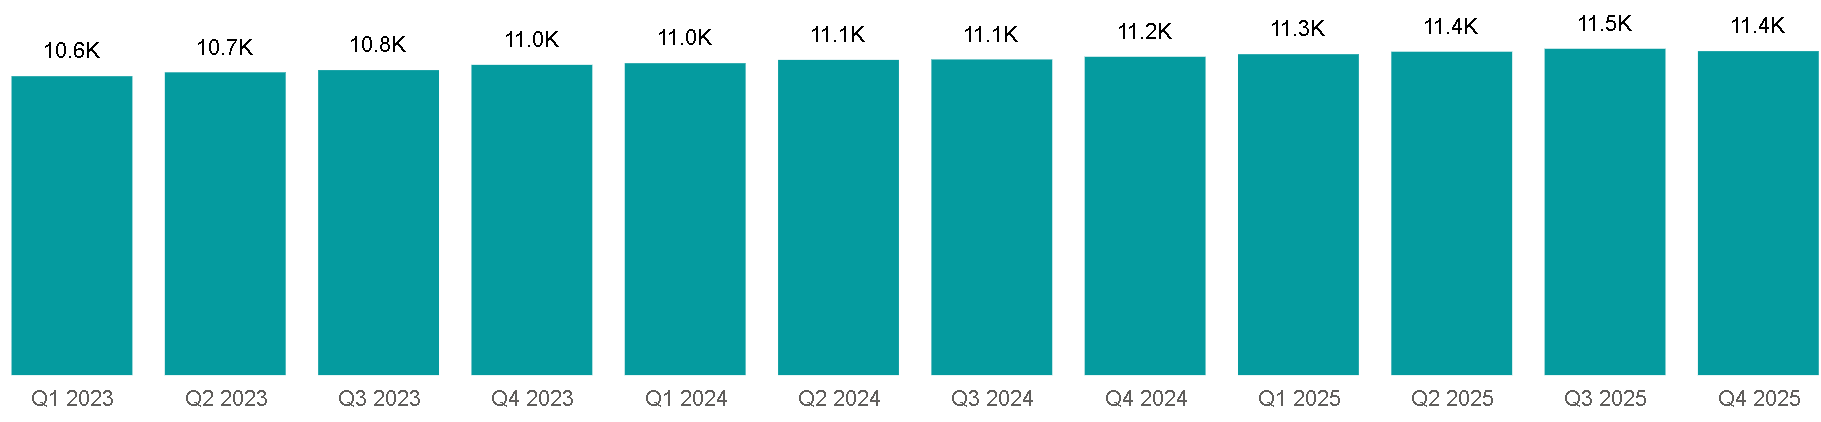
In Q1 2026, there were more active consultants (11,600) than in any other quarter over the past five years.
The number of consultants active in private healthcare regularly fluctuates as new consultants start working in the private sector, and existing ones go on sabbatical, stop working privately, or retire.
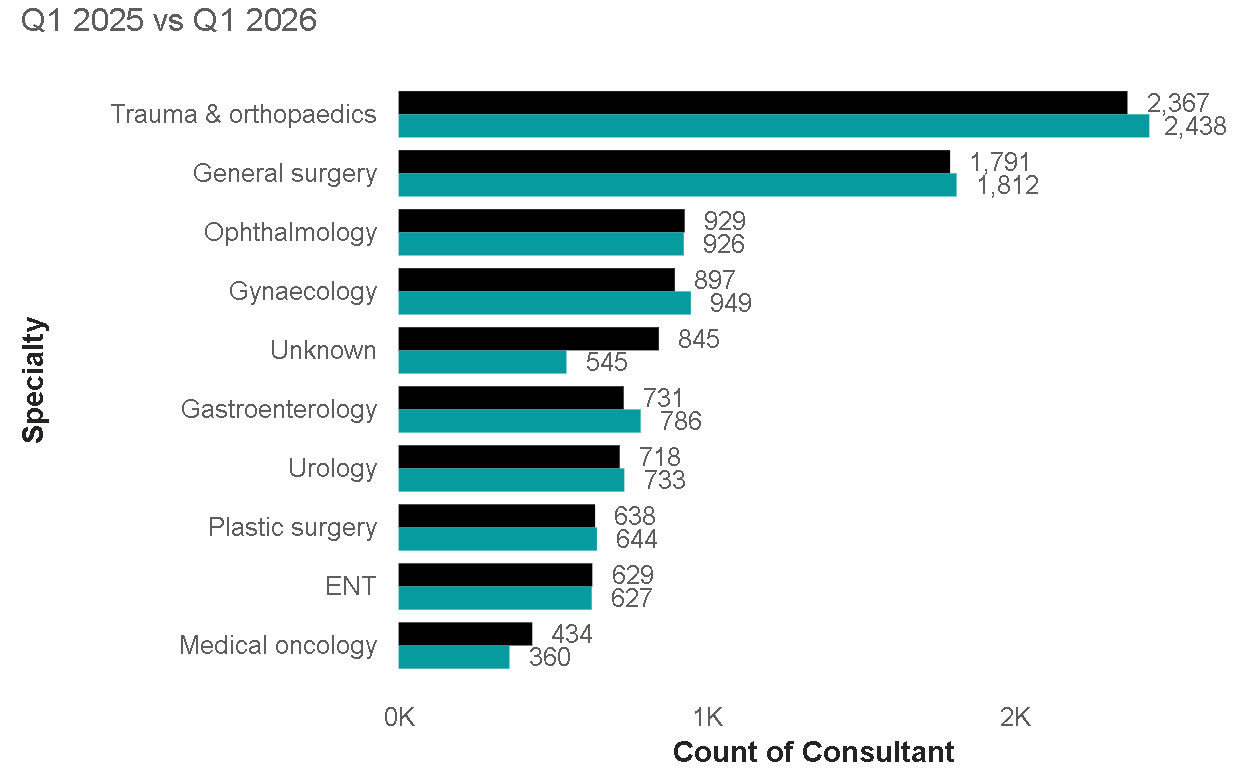
There was an increase in the number of active consultants in each of the named specialties in the top 10 except for ‘Ophthalmology’, ‘ENT’ and ‘Medical Oncology’.
The largest increases by number of consultants were in ‘Trauma and orthopaedics’ (71) and ‘Gastroenterology’ (55).
The largest percentage increases came in ‘Gastroenterology’ (7.5%) and ‘Gynaecology’ (5.8%).
Patient demographics
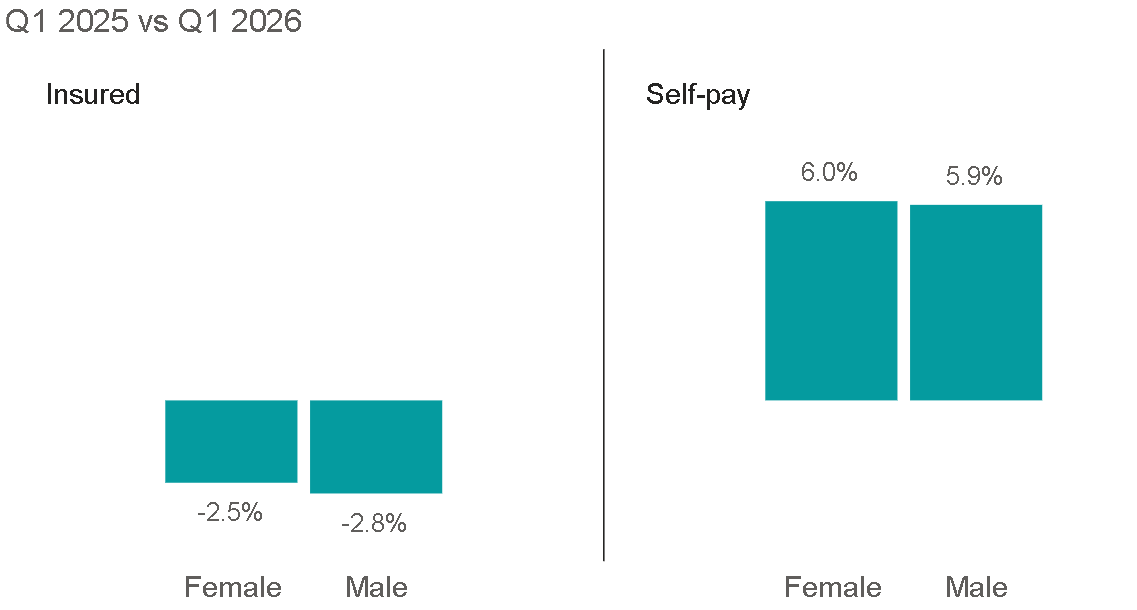
Insured admissions decreased for both sexes across the UK, and there was an increase in self-pay admissions.
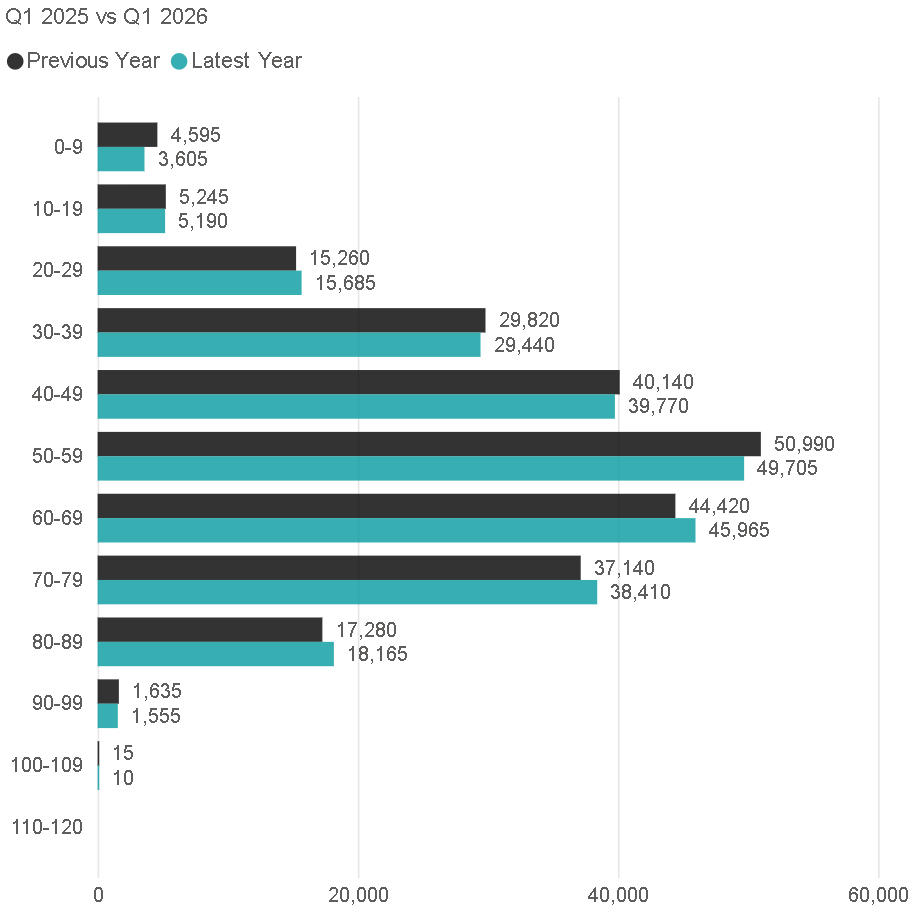
The most admissions (49,705) came for patients in the 50-59 age group, however this was a lower total (-1,285) than in Q1 2025.
The largest volume increase was for the 60-69 age group (1,545) and 70-79 (1,270).
The biggest decreases in admissions by percentage are seen in the youngest and oldest age groups, with those aged 0-9 down 22%, and those 100-109 down 33%. The 0-9 age group also had the largest volume decrease (990).
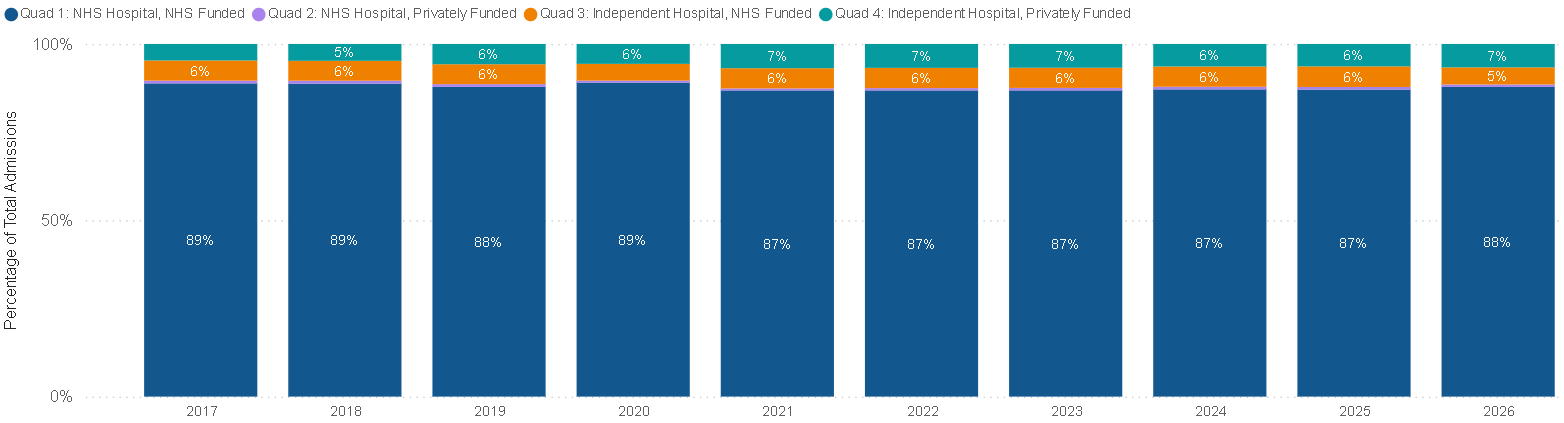
The proportion of admissions in the NHS increased (1%) compared to Q1 2025. Admissions at private hospitals funded privately (insurance or self-pay) remained the same. There was a small decline in admissions to private hospitals that are funded by the NHS.
The majority of admissions (88%) remained ‘NHS Hospital, NHS Funded’.
Important notes
All data described above is taken from PHIN’s unique, national private dataset describing discharge activity (day case and inpatient). This excludes activity outside of PHIN’s mandate from the Competition and Markets Authority, such as outpatient diagnostics, physiotherapy and mental health services. NHS data comes from the Hospital Episode Statistics (HES) dataset.
There is a time lag between collecting, validating and processing the data we receive from hospitals before we can publish it. This can be up to six months after treatment has been completed, to ensure a fair process and accurate data.
Occasionally, hospitals may submit data after our deadline. This will not be included in the current quarter’s Market Update, but will be added to future ones. For this reason, we always recommend only using figures from the latest Update as they can change.
For ease of use, we have reduced the number of years of data shown in the Market Update. If you would like to access pre-2023 data, please get in touch.
Activity numbers have been rounded to the nearest five, with percentages based on the unrounded figures.