In the latest of our quarterly updates, we use our unique national dataset to provide a comprehensive view of the key trends in Wales’s independent healthcare sector, covering data up to and including the end of Q3 2025.
The data covers private healthcare in-patient/day-case market activity and includes breakdowns by year for insured cases, ‘self-pay’, Top 10 procedures and demographics.
(Q1 = Jan – Mar; Q2 = Apr – Jun; Q3 = Jul – Sep; Q4 = Oct – Dec)
Private healthcare sector market activity
At a glance
Changes from Q3 2024 to Q3 2025:
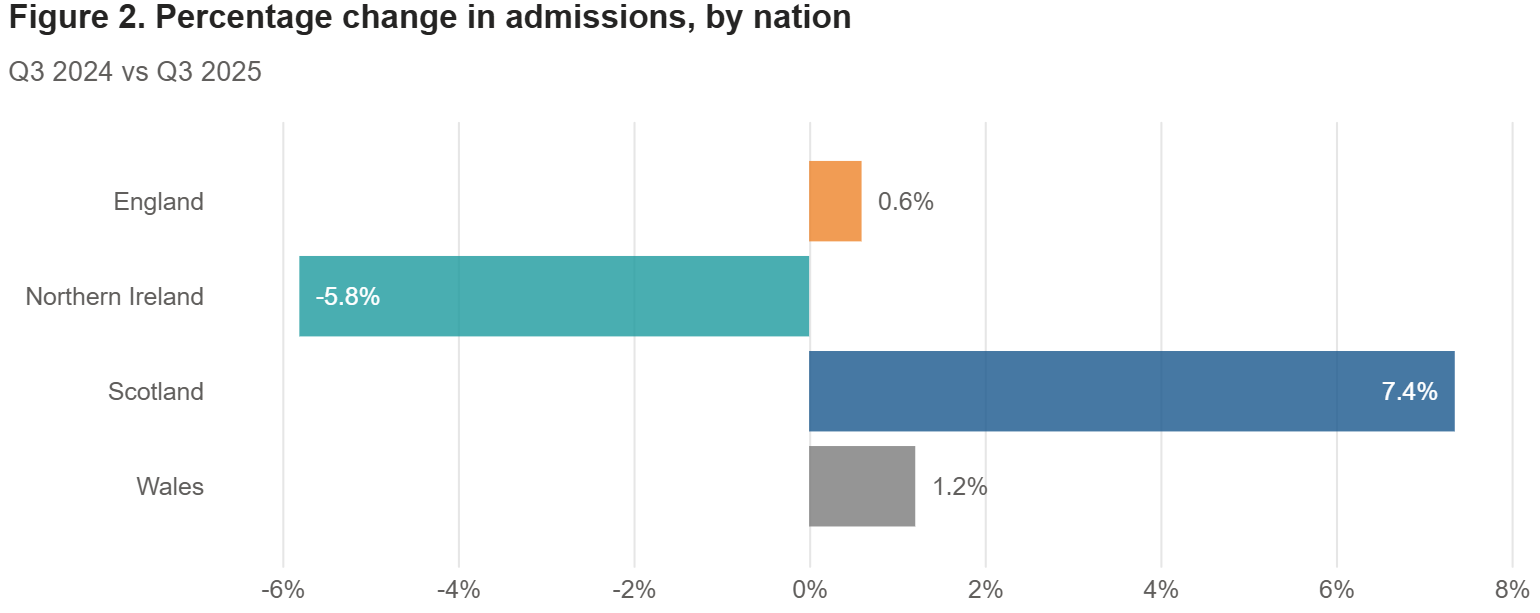
- Reported private hospital/clinic admissions were up 1% in Wales to highest ever Q3 figure.
- Private medical insurance admissions rose by 2%.
- Self-pay admissions increased by 1%.
- Funding for admissions was 57% self-pay and 43% insurance funded.
Private healthcare in-patient admissions down in the second quarter of 2025
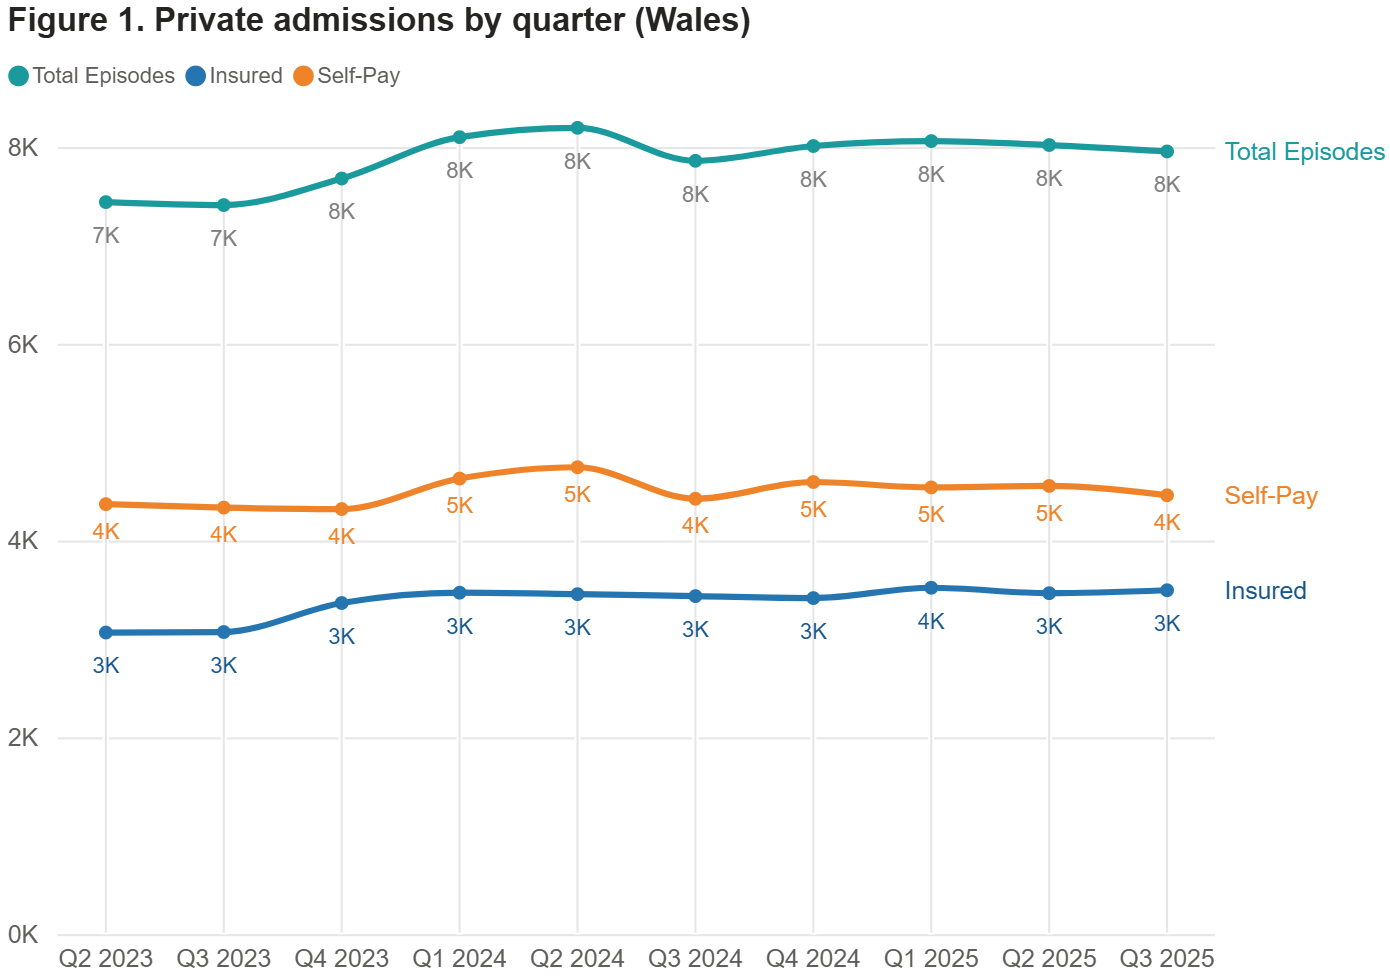
The total number of admissions in Q3 2025 was 7,955 which is 1% above Q3 2024. This continues the trend of rising admissions in Q3s. Admissions have gone up in every Q3 since 2020.
Self-pay continues to be the dominant payment method in Wales, unlike any other UK nations.
Self-pay down and private medical insurance funded admissions remain constant
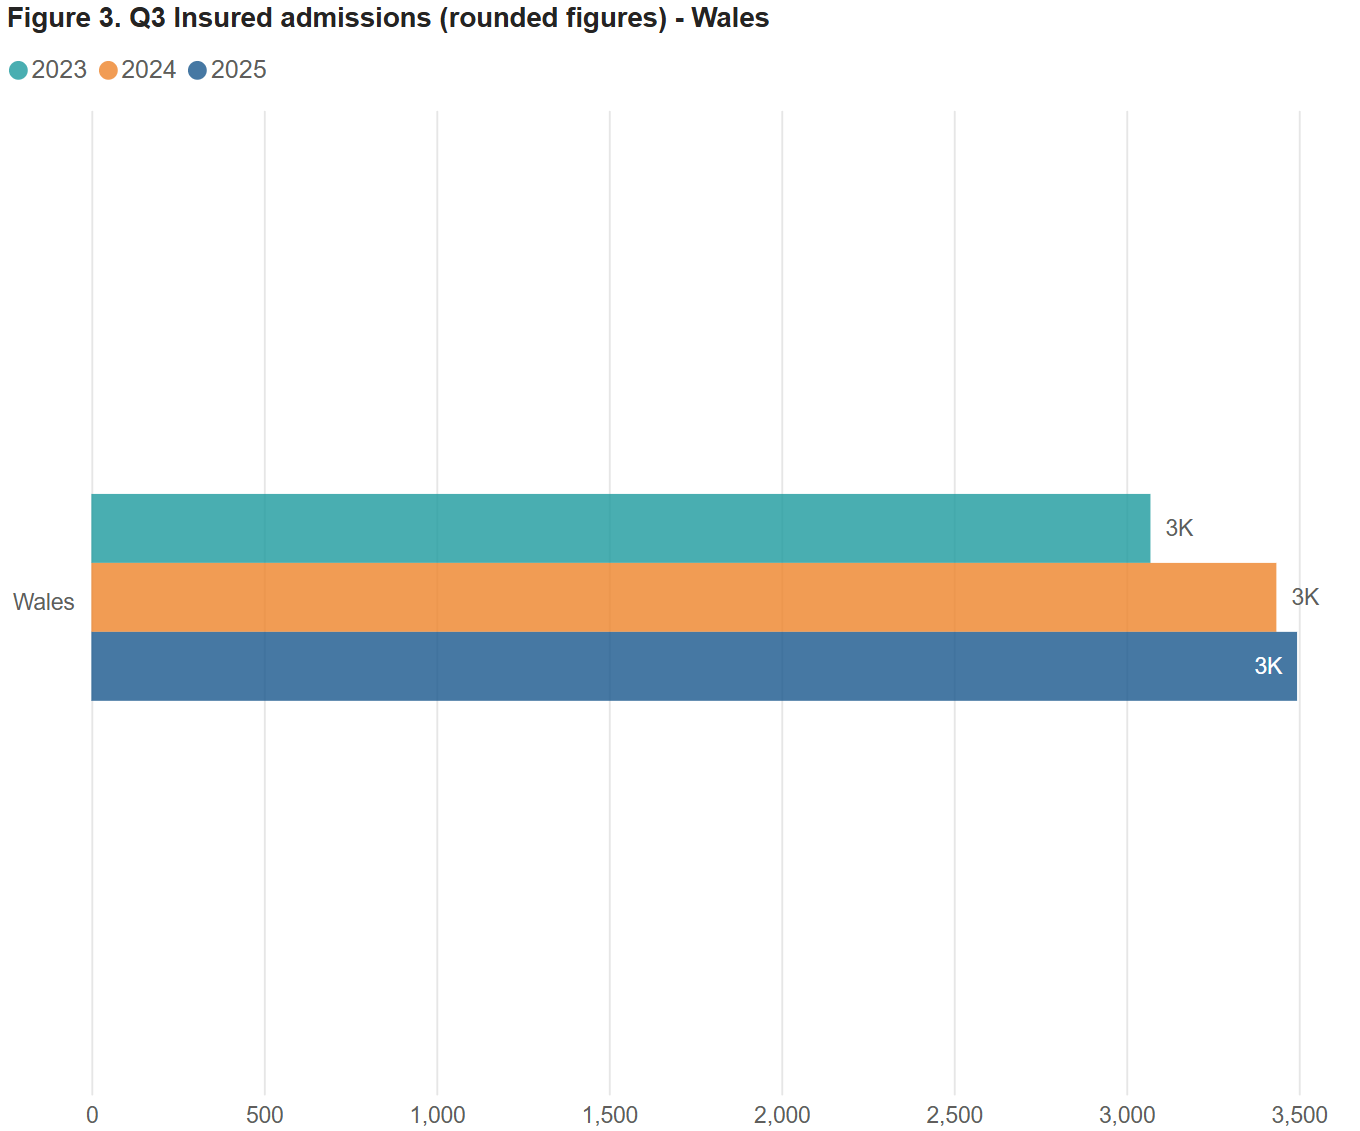
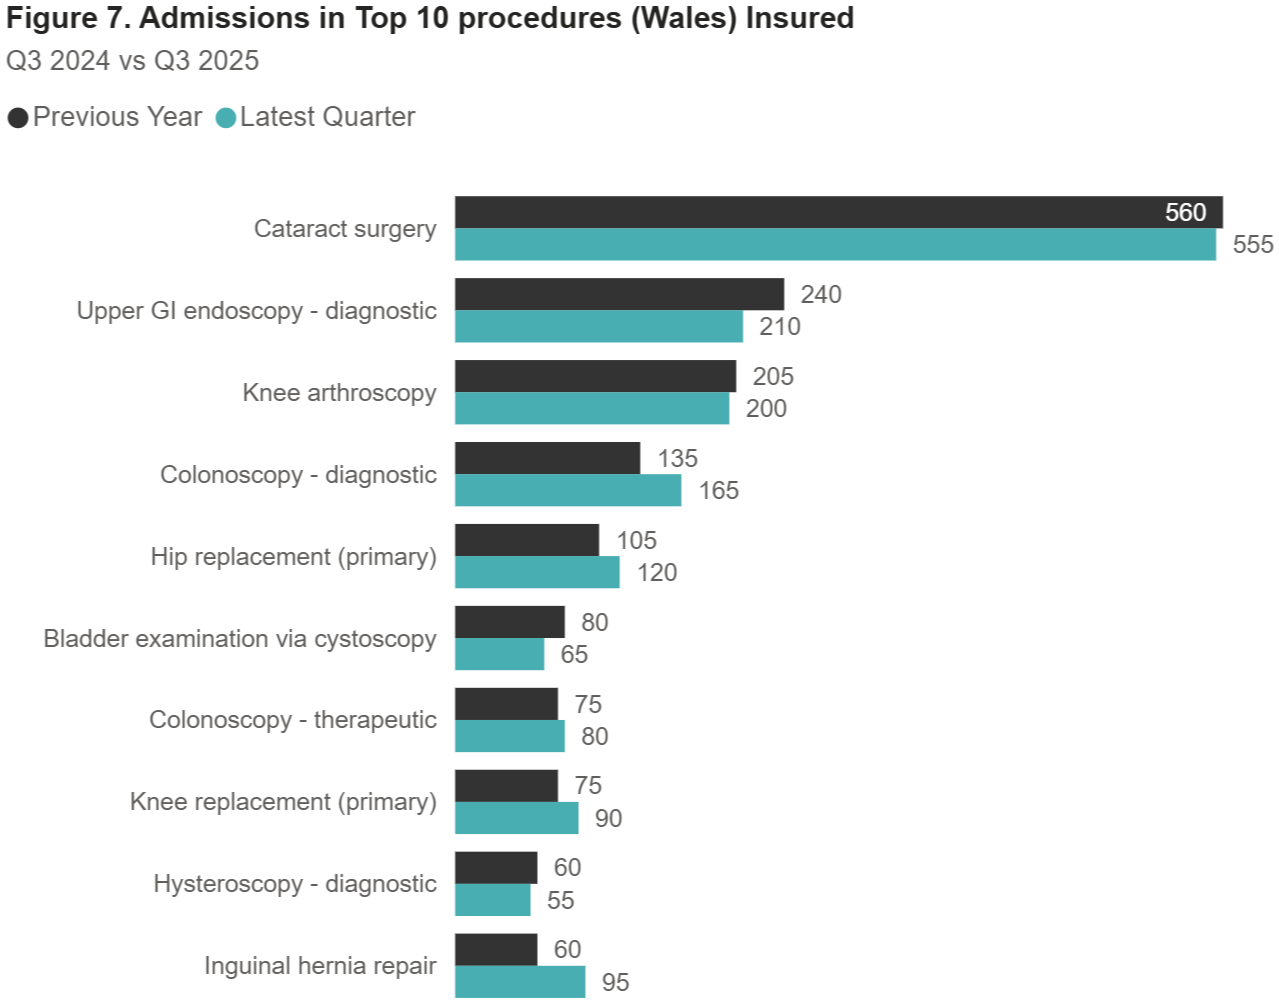
Insured admissions
Reported admissions paid for with private medical insurance in Q3 2025 were up by 60 (2%) compared to the same period in 2024.
Insured admissions were up in every UK nation except for Northern Ireland.
Self-pay admissions
Self-pay admissions in Wales in Q3 2025 were up by 35 (1%) compared to Q3 2024.
Self-pay was up in every UK nation except for England.
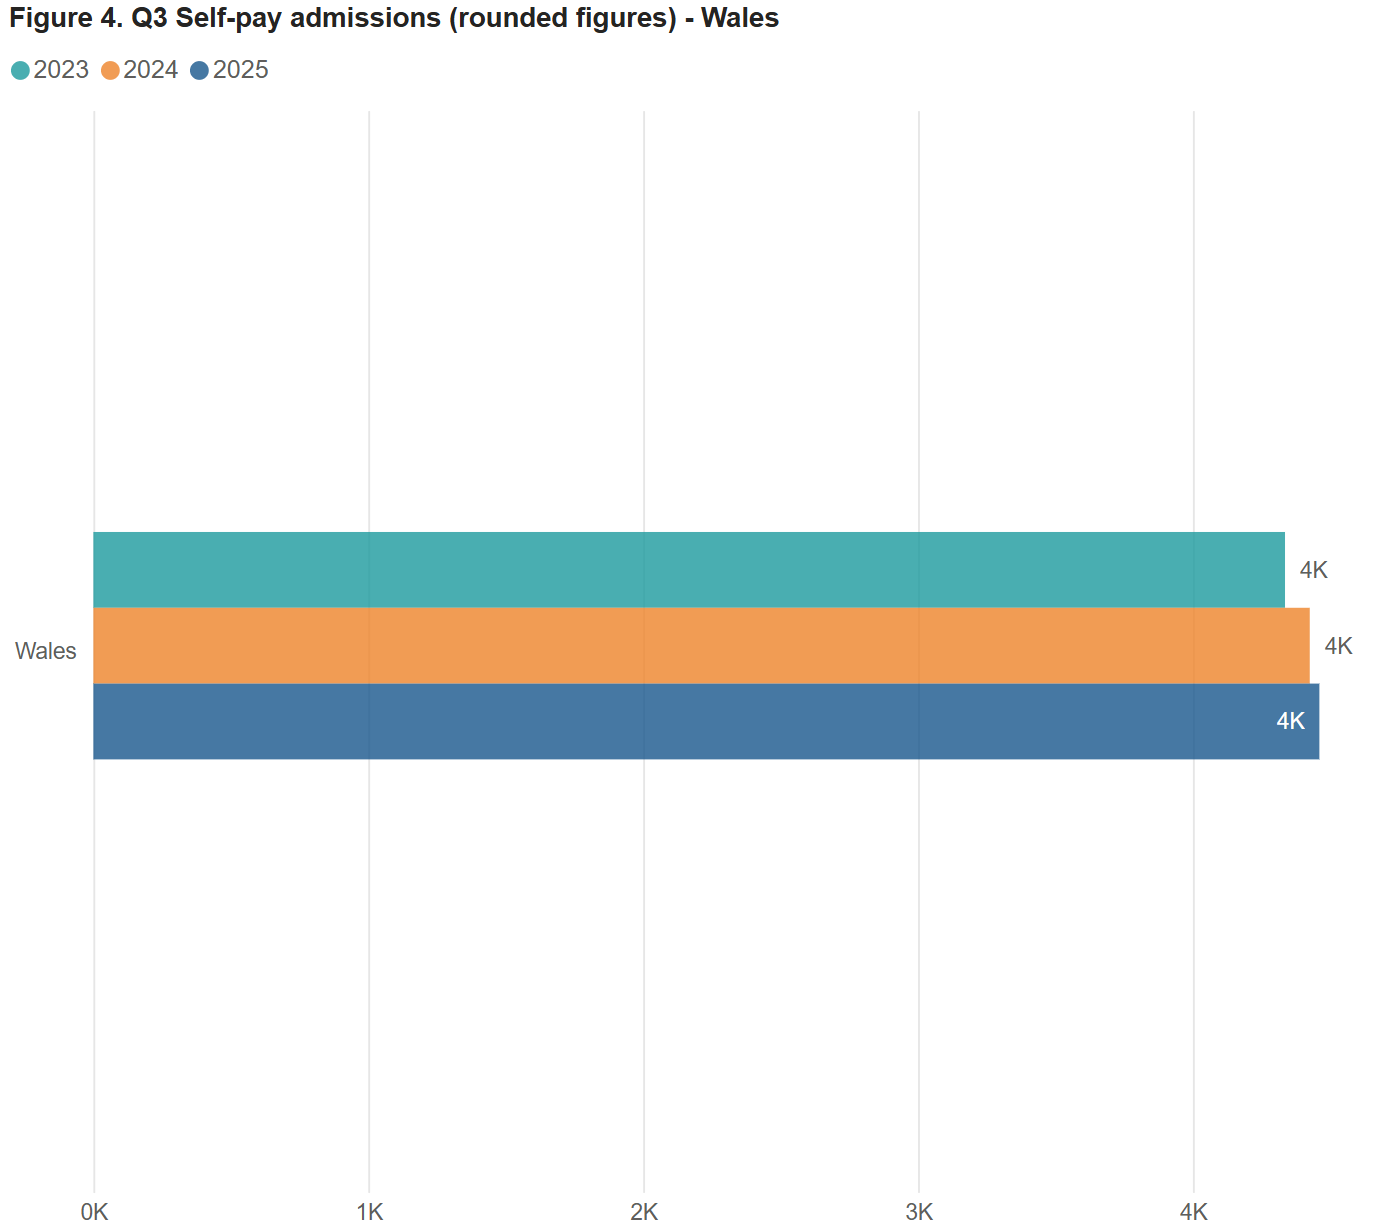
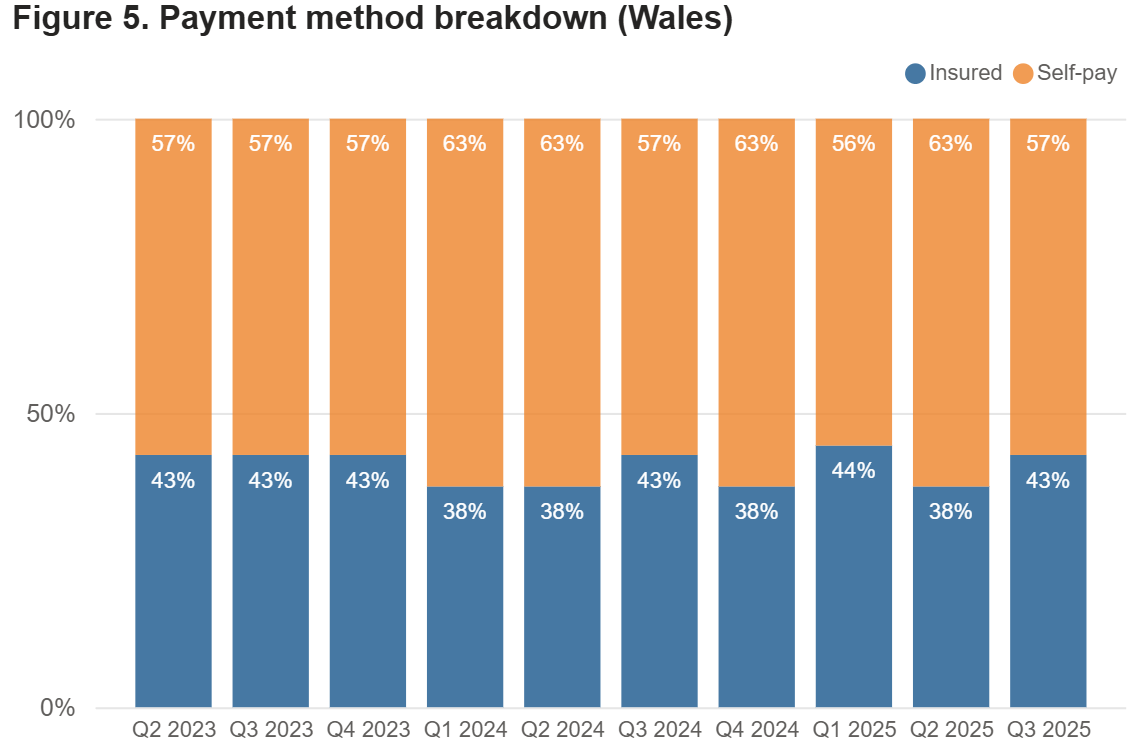
The proportion of admissions paid for using each funding method was the same as in Q3 2024.
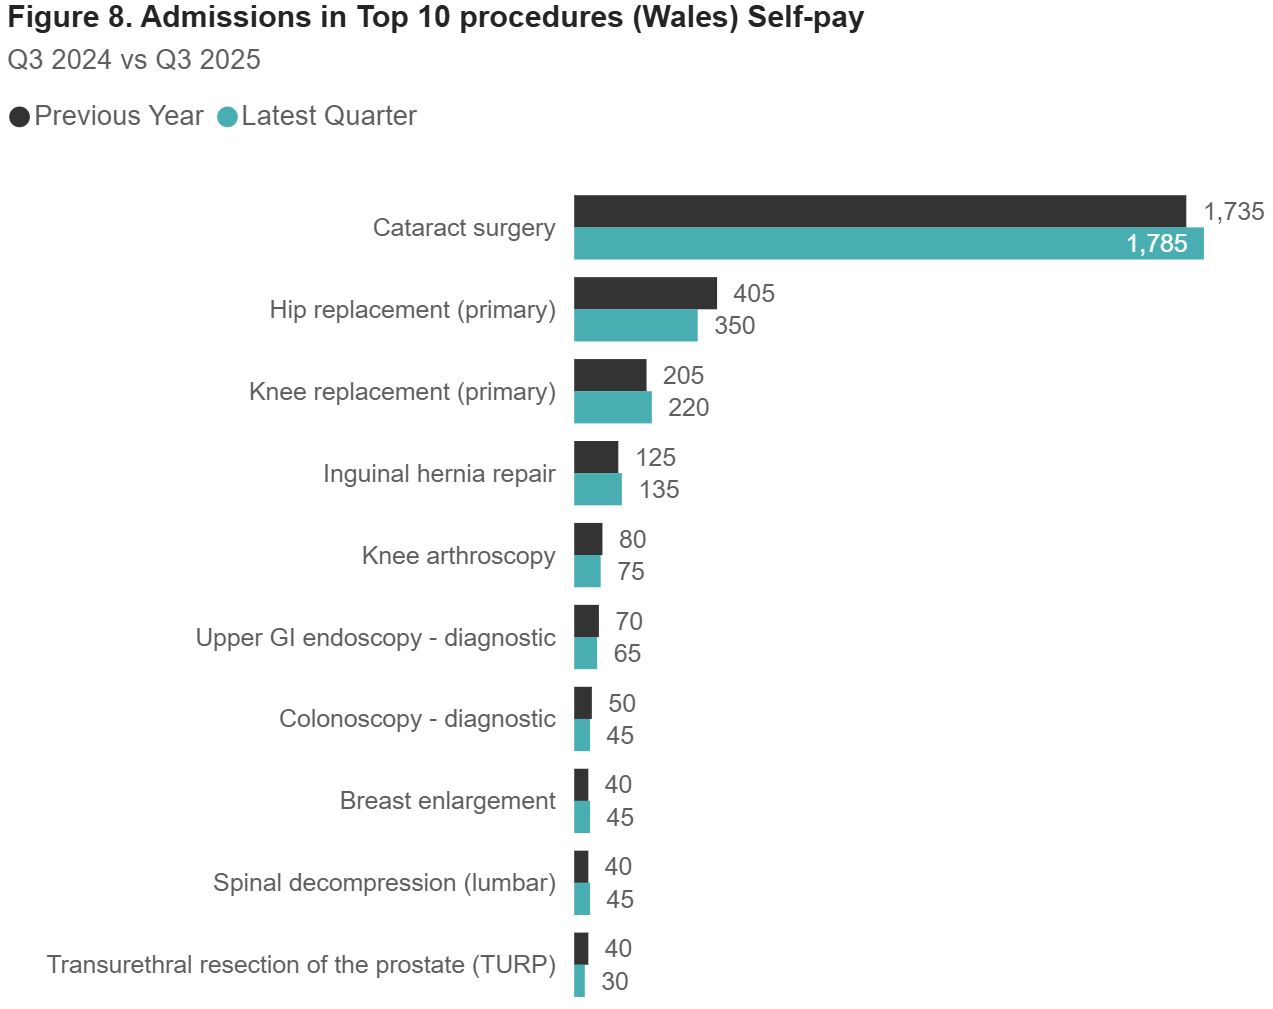
Top 10 procedures
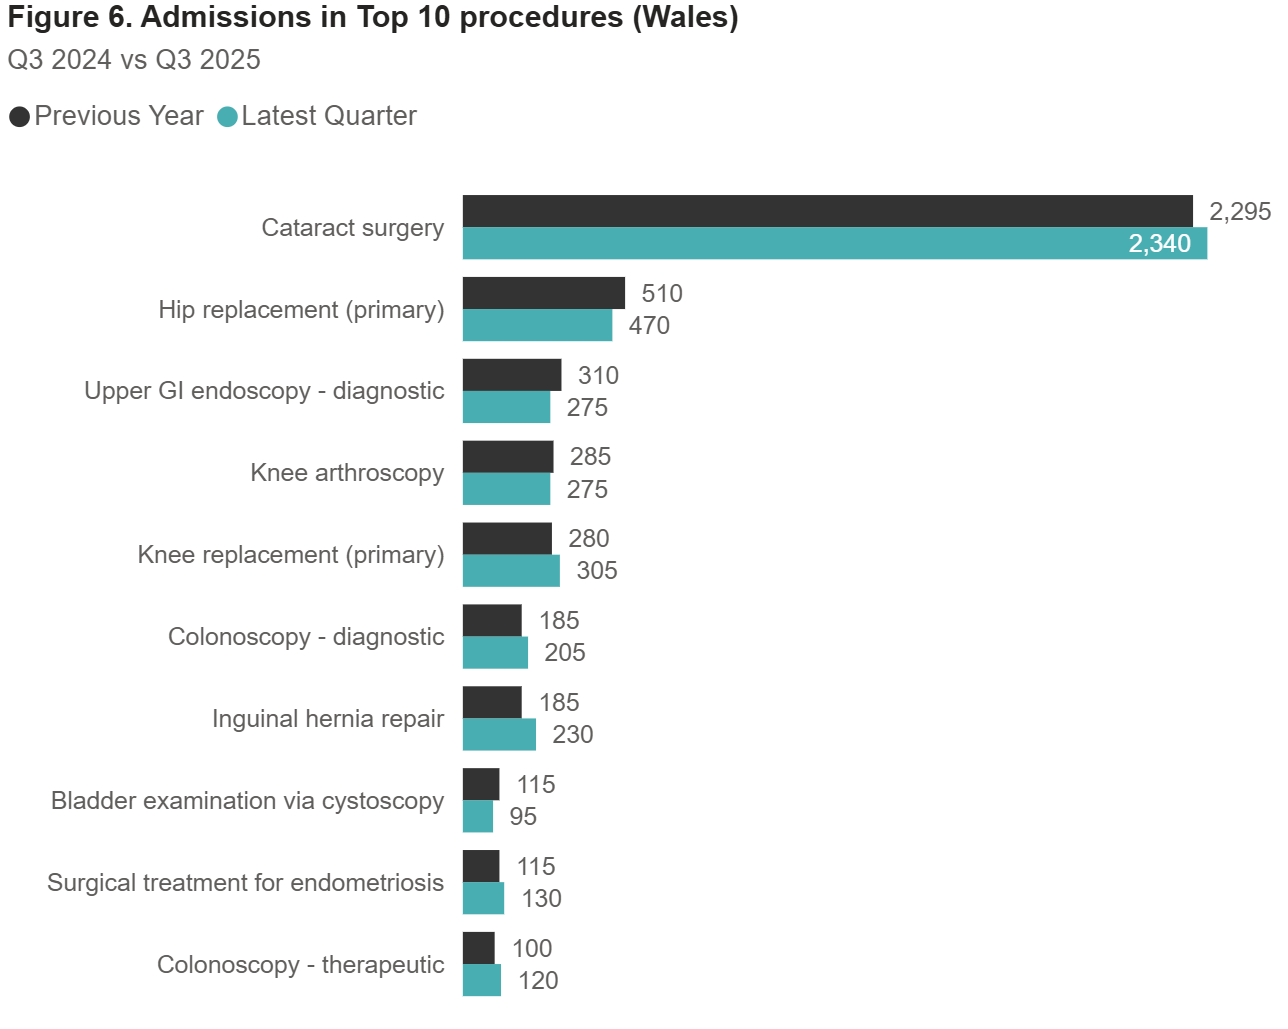
There was an increase in admissions for six of the Top 10 procedures by volume when comparing Q3 2025 to Q3 2024.
‘Cataract surgery’ (2,340 admissions) is the largest procedure by volume and increased by 45 (2%). ‘Hip replacement’ (470) is the second largest but decreased by 40 (8%). ‘Inguinal hernia repair’ had the largest percentage increase (24%), and equal highest volume increase (45) but is a less common procedure (230).
The Top 3 procedures by Q2 volume are:
- ‘Cataract surgery’ (2,340)
- ‘Hip replacement’ (470)
- ‘Upper GI endoscopy - diagnostic’ (275)
Outside the Top 10, two varicose vein procedures (‘Combined treatments’ 33% and ‘Sclerotherapy’ 43%) were among the biggest percentage increases.
Active consultants in private healthcare
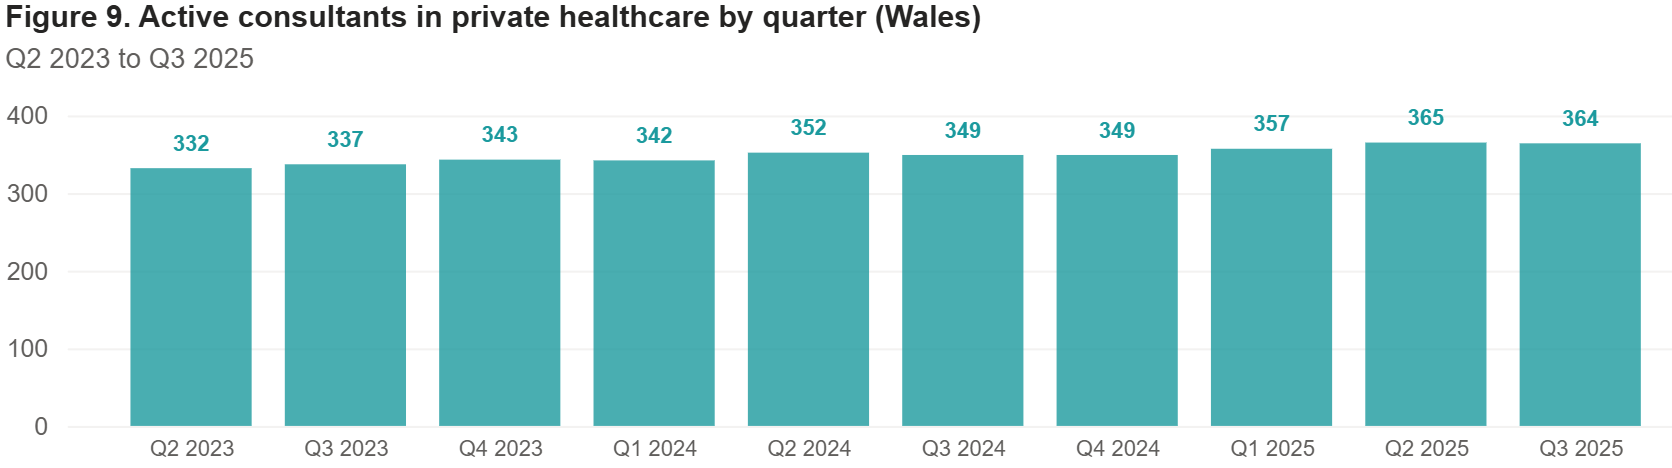
The number of consultants active in private healthcare regularly fluctuates as new consultants start working in the private sector, and existing ones go on sabbatical, stop working privately, or retire.
In Q3 2025, there were 364 active consultants in Wales. That is 15 more than in Q3 2024.
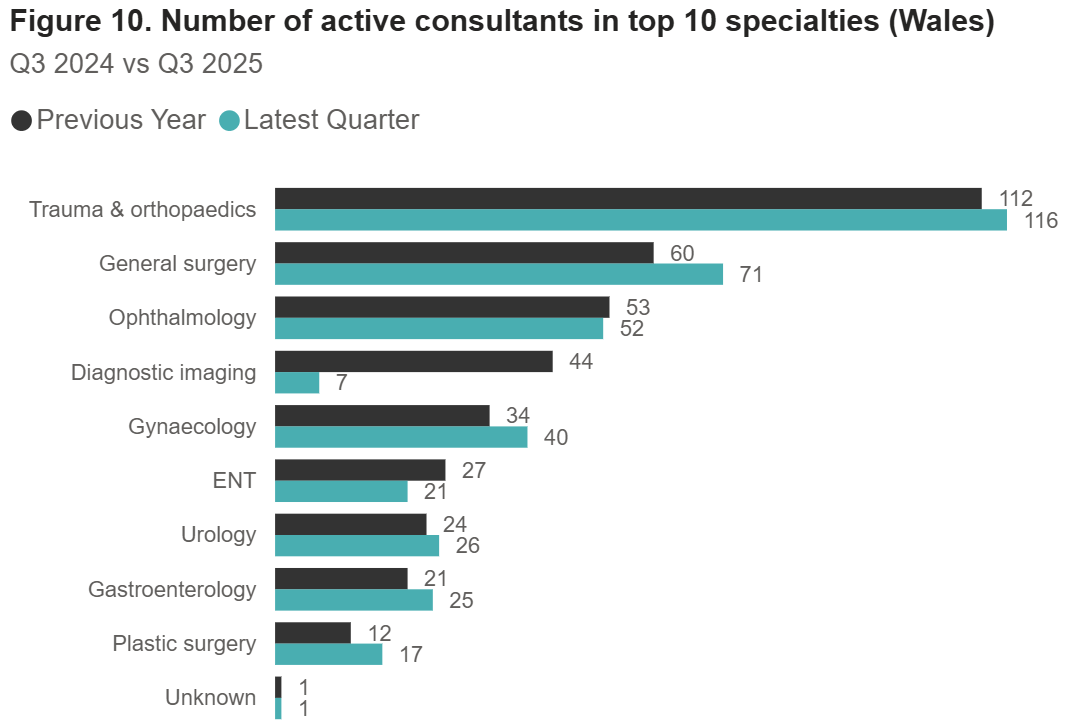
‘Trauma and orthopaedics’ had the highest volume of active consultants (116).
‘General Surgery’ had the largest volume increase in active consultants in the top 10 procedure groups (11 extra consultants). Plastic surgery had the largest percentage increase (42%).
‘Diagnostic imaging’ saw the biggest declines by volume (-37) and percentage (-84%).
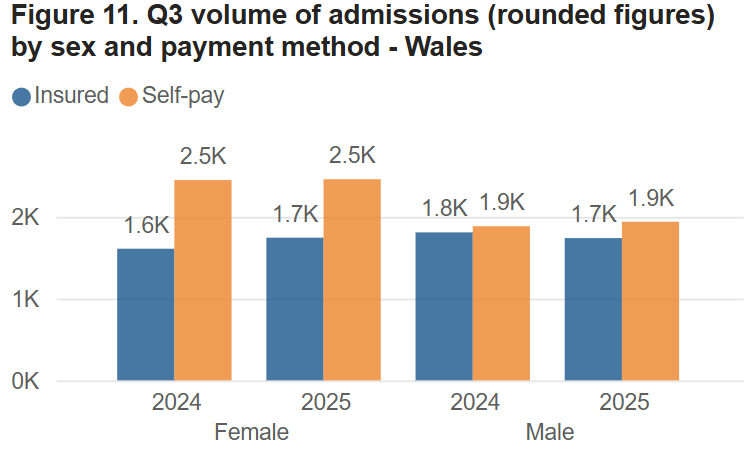
Patient demographics
Self-pay funded admissions rose slightly for both male (3%) and female (0.4%) patients. Insured admissions increased by 8% for female patients, but fell by 4% for male patients compared to Q3 2024.
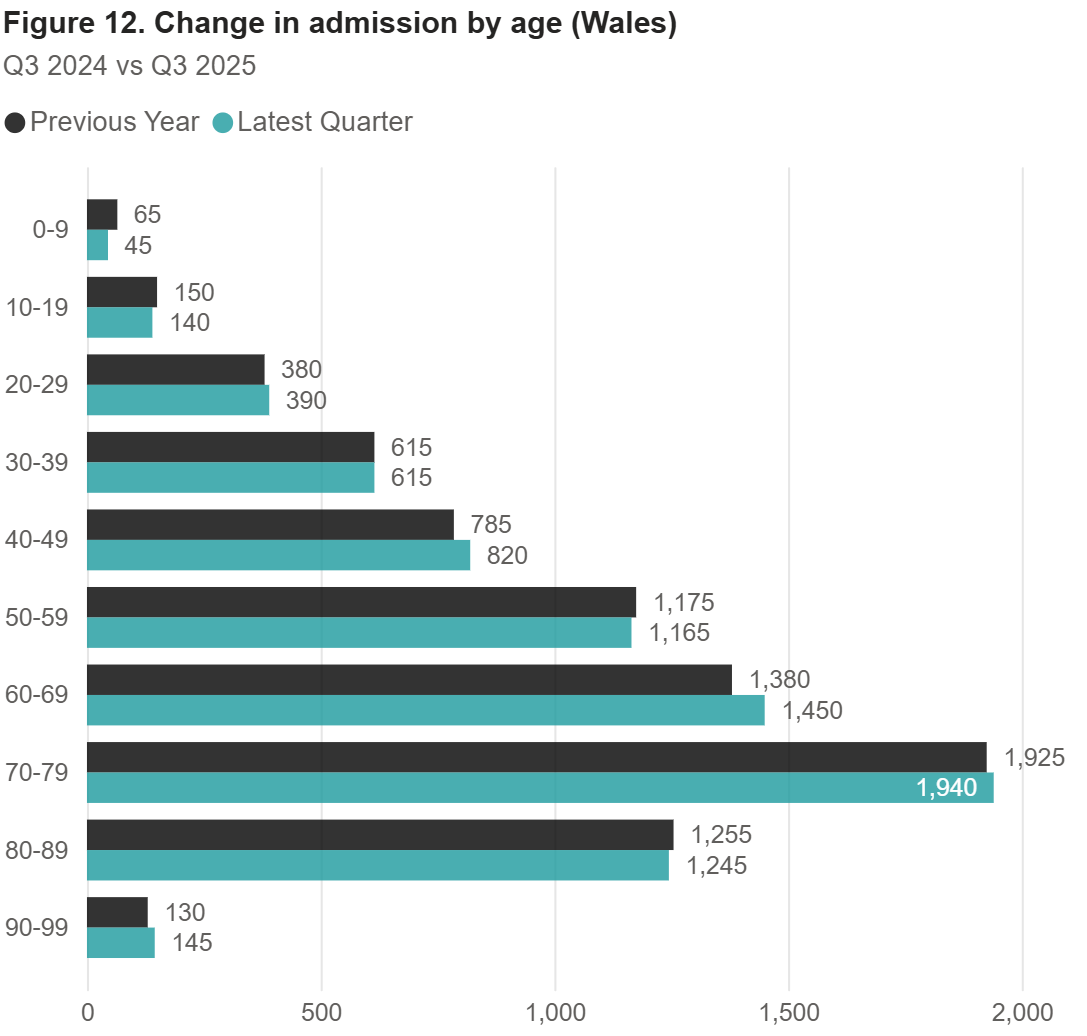
There was a decrease in admissions in the following age groups 0-9, 10-19, 50-59 and 80-89 year olds in Q3 2025 compared to the same quarter in 2024. Of those groups, the largest volume decrease (20) and percentage decrease (31%) was for the 0-9 year olds.
Conversely, the largest volume increase (70) was in the 60-69 group and percentage increase (12%) was in the 90-99 age group.
70-79 was the most common age for procedures with 1,940, followed by 60-69 (1,450). The fewest admissions came in the 0-9 age group (45).
Important notes
All data described above is taken from PHIN’s unique, national private dataset describing discharge activity (day case and inpatient). This excludes activity outside of PHIN’s mandate from the Competition and Markets Authority, such as outpatient diagnostics, physiotherapy and mental health services.
There is a time lag between collecting, validating and processing the data we receive from hospitals before we can publish it. This can be up to six months after treatment has been completed, to ensure a fair process and accurate data.
On occasions, hospitals may submit data after our deadline. This will not be included in the current quarter’s Market Update, but will be added to future ones. For this reason, we always recommend only using figures from the latest Update as they can change.
For ease of use, we have reduced the number of years of data shown in the Market Update, if you would like pre-2023 data, please get in touch.
Activity numbers have been rounded to the nearest five, with percentages based on the unrounded figures.