In the latest of our quarterly updates, we use our unique, national dataset to provide a comprehensive view of the key trends in the independent healthcare sector up to, and including, the end of 2025.
The data covers private healthcare in-patient/day-case market activity and includes breakdowns by year for insured cases, ‘self-pay’, Top 10 procedures and demographics.
Figures are rounded to the nearest 1,000. The total may not add as this is calculated using the actual figure then rounded.
(Q1 = Jan – Mar; Q2 = Apr – Jun; Q3 = Jul – Sep; Q4 Oct – Dec)
At a glance
Changes from 2024 to 2025:
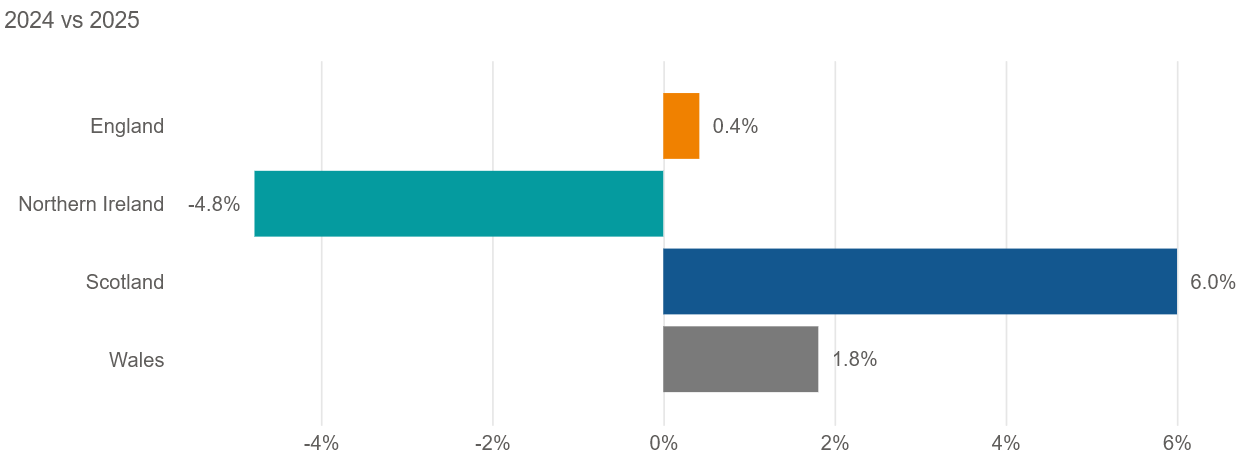
- Reported private hospital/clinic admissions were up 2% to reach record levels.
- Private medical insurance admissions were up 2% and at their highest ever.
- Self-pay admissions were up 1% to also reach a record total.
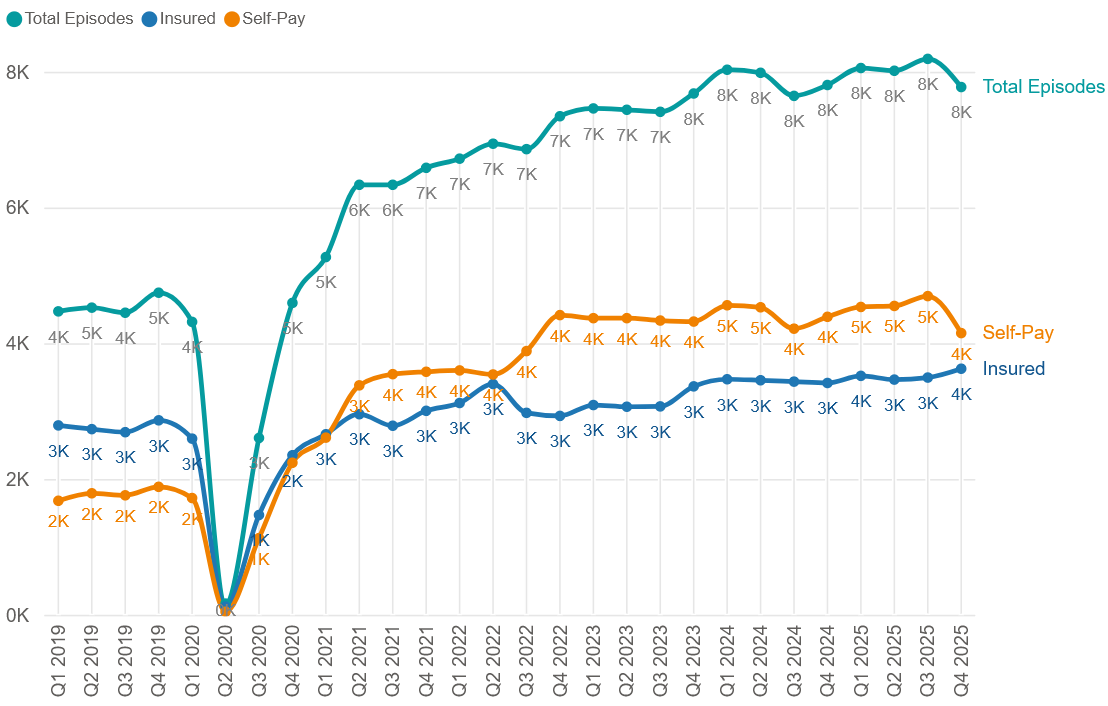
- Quarter 1 (Jan-Mar) 2025 had the highest quarterly total ever for both payment methods.
Multiple records broken
The total number of private hospital admissions in 2025 was 570 (2%) above 2024, meaning that the private sector admissions in Wales broke the record for the fifth consecutive year.
Q3 (Jul-Sep) 2025 set a record for the number of admissions in a quarter. It is unusual for in the UK nations for a Q3 to be the highest.
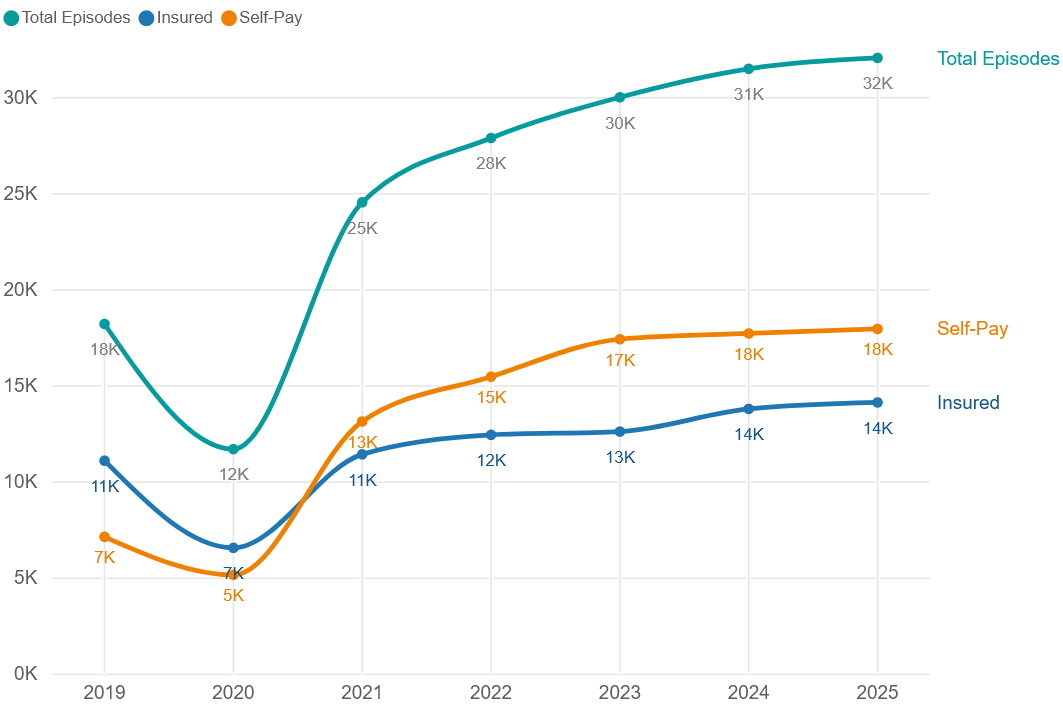
Record levels of self-pay and insured funded admissions
Self-pay admissions
There were 17,930 self-pay funded admissions in 2025. This was up 1% (an extra 235 admissions) compared to 2024.
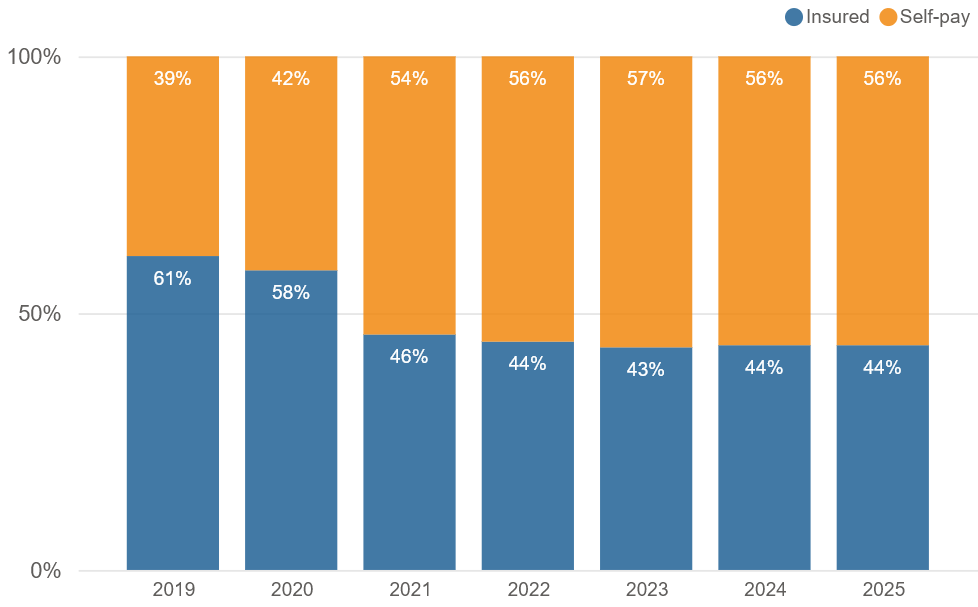
Wales remains the only nation where self-pay is the predominant method of payment. The proportion of admissions by payment method remained consistent (Self-pay 56% and insured 44%).
Insured admissions
There were more admissions (14,105) paid for with private medical insurance in 2025 than in any previous year.
This was a 2% increase (extra 335 admissions) on 2024.
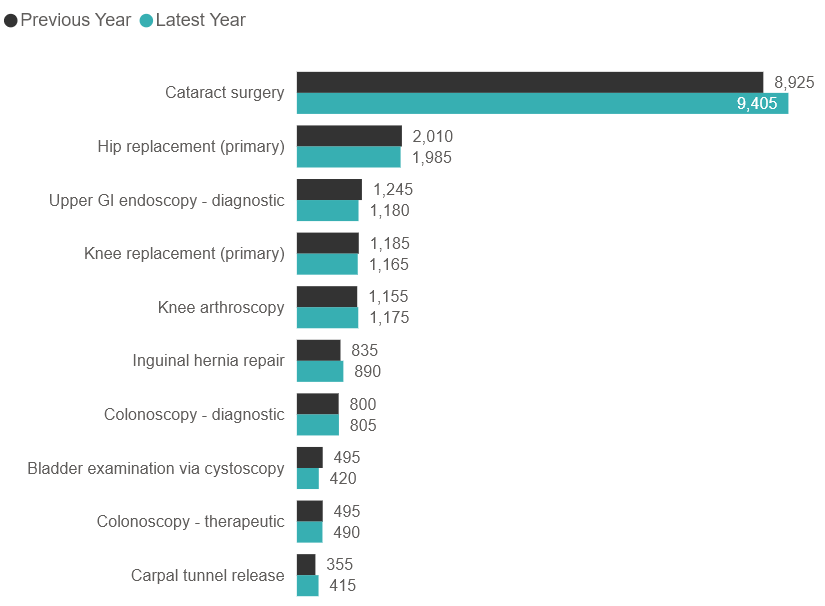
Top 10 procedures in Wales
All of the Top 10 procedures in 2025 remained the same as in 2024. The only change that ‘Bladder examination via cystoscopy’ and ‘Colonoscopy – therapeutic’ swapped positions (8th and 9th).
‘Cataract surgery’ remains by far the most common procedure and also had the highest volume increase (480 admissions). ‘Carpal tunnel release’ had the highest percentage increase (16.9%).
Five procedures in the Top 10 had a decrease in admissions with the largest volume (75 admissions) and percentage (15.2%) falls coming in ‘Bladder examination via cystoscopy’.
Changes in most common admissions by payment method
‘Cataract surgery’ is the most popular procedure for either payment method.
There are three procedures that only appear in the self-pay funded Top 10. They are ‘Breast enlargement’, ‘Spinal decompression (lumbar)’ and ‘Carpal tunnel release’.
For insured admissions, the three different procedures are ‘Hysteroscopy – diagnostic’ (a gynaecology scope) and ‘Colonoscopy – therapeutic’ and ‘Bladder examination via cystoscopy’ (gastroenterology scopes).
Top 10 procedures by year (2019 - 2025)
| Procedure group | 2019 | 2020 | 2021 | 2022 | 2023 | 2024 | 2025 |
|---|---|---|---|---|---|---|---|
| Bladder examination via cystoscopy | 430 | 220 | 410 | 470 | 480 | 495 | 420 |
| Carpal tunnel release | 250 | 175 | 360 | 245 | 310 | 355 | 415 |
| Cataract surgery | 3,080 | 2,545 | 6,590 | 7,460 | 7,960 | 8,925 | 9,405 |
| Colonoscopy - diagnostic | 790 | 430 | 635 | 735 | 750 | 800 | 805 |
| Colonoscopy - therapeutic | 190 | 135 | 395 | 480 | 500 | 495 | 490 |
| Hip replacement (primary) | 855 | 785 | 1,815 | 2,040 | 2,100 | 2,010 | 1,985 |
| Inguinal hernia repair | 440 | 385 | 775 | 875 | 870 | 835 | 890 |
| Knee arthroscopy | 865 | 600 | 995 | 1,025 | 1,120 | 1,155 | 1,175 |
| Knee replacement (primary) | 570 | 455 | 880 | 1,080 | 1,150 | 1,185 | 1,165 |
| Upper GI endoscopy - diagnostic | 950 | 565 | 1,070 | 1,070 | 1,255 | 1,245 | 1,180 |
Top 10 procedures by year (2019 - 2025) – Insurance funded
| Procedure group | 2019 | 2020 | 2021 | 2022 | 2023 | 2024 | 2025 |
|---|---|---|---|---|---|---|---|
| Bladder examination via cystoscopy | 330 | 160 | 275 | 320 | 330 | 340 | 290 |
| Cataract surgery | 1,185 | 890 | 1,890 | 2,080 | 1,825 | 2,170 | 2,295 |
| Colonoscopy - diagnostic | 630 | 325 | 430 | 530 | 540 | 580 | 620 |
| Colonoscopy - therapeutic | 160 | 110 | 340 | 355 | 340 | 355 | 330 |
| Hip replacement (primary) | 320 | 270 | 510 | 465 | 330 | 415 | 450 |
| Hysteroscopy - diagnostic | 130 | 85 | 155 | 205 | 225 | 260 | 270 |
| Inguinal hernia repair | 260 | 195 | 350 | 330 | 330 | 315 | 375 |
| Knee arthroscopy | 670 | 430 | 650 | 685 | 740 | 820 | 840 |
| Knee replacement (primary) | 255 | 170 | 255 | 275 | 285 | 340 | 370 |
| Upper GI endoscopy - diagnostic | 800 | 460 | 795 | 765 | 865 | 895 | 860 |
Top 10 procedures by year (2019 - 2025) – Self-pay funded
| Procedure group | 2019 | 2020 | 2021 | 2022 | 2023 | 2024 | 2025 |
|---|---|---|---|---|---|---|---|
| Breast enlargement | 260 | 120 | 190 | 200 | 210 | 190 | 175 |
| Carpal tunnel release | 85 | 80 | 170 | 135 | 140 | 160 | 175 |
| Cataract surgery | 1,895 | 1,655 | 4,700 | 5,380 | 6,140 | 6,760 | 7,110 |
| Colonoscopy - diagnostic | 160 | 100 | 200 | 205 | 210 | 220 | 180 |
| Hip replacement (primary) | 535 | 510 | 1,305 | 1,575 | 1,770 | 1,595 | 1,530 |
| Inguinal hernia repair | 185 | 190 | 425 | 540 | 545 | 525 | 515 |
| Knee arthroscopy | 195 | 175 | 345 | 340 | 380 | 335 | 335 |
| Knee replacement (primary) | 315 | 285 | 625 | 805 | 865 | 845 | 795 |
| Spinal decompression (lumbar) | 110 | 70 | 110 | 145 | 200 | 180 | 185 |
| Upper GI endoscopy - diagnostic | 150 | 105 | 280 | 305 | 390 | 345 | 320 |
Active consultants in private healthcare by year
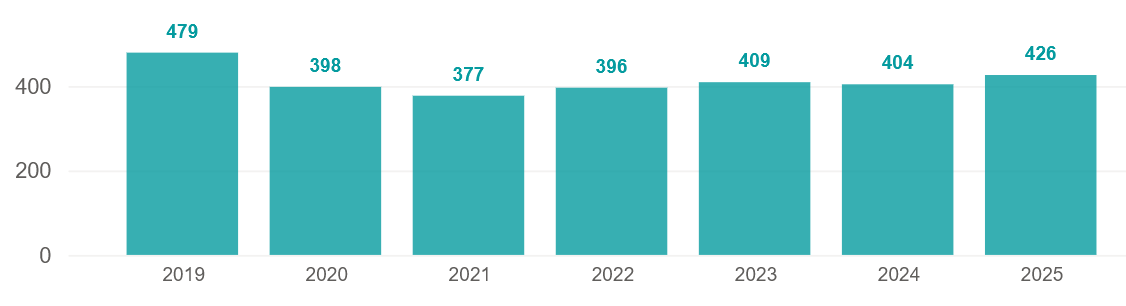
As might be expected with record admission figures, there were more active consultants (399) in the private sector in Wales than ever before. This is the fifth year in a row with an increase.
The number of consultants active in private healthcare regularly fluctuates as new consultants start working in the private sector, and existing ones go on sabbatical, stop working privately, or retire.
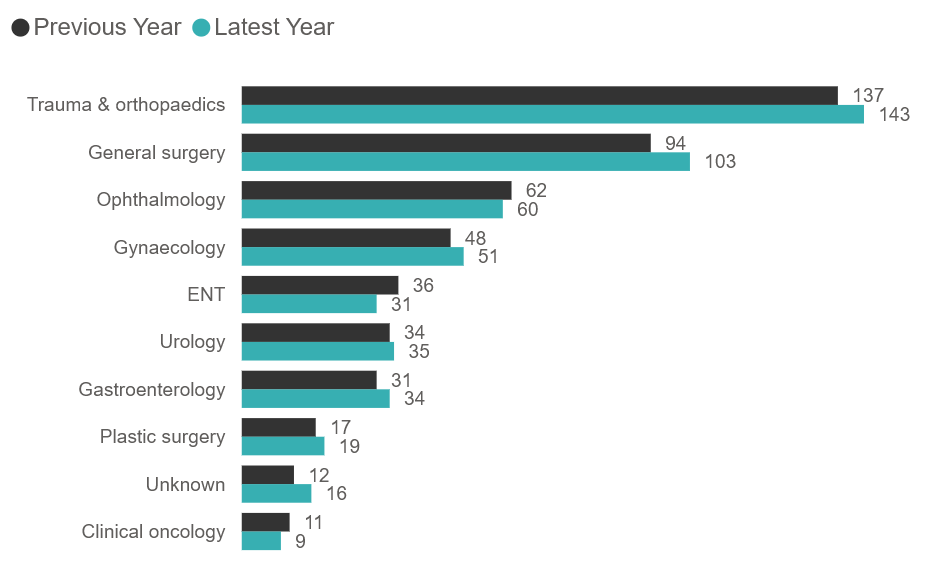
There were an additional three consultants working in ‘Trauma & orthopaedics’ which is the specialist area with the most active consultants (140).
The largest volume increase (11) came in ‘General surgery’.
The largest decline came in ‘Diagnostic imaging’ where there were 42 fewer consultants (61%) than in 2024.
Patient demographics
Payment method
There was an increased number of insured admissions for both sexes in 2025 compared to 2024. Female insured funded admissions increased by 4.1% and male admissions 1.1%.
Reported female self-pay funded admissions fell by 0.7% but male admissions saw an increase of 4.2%. There were more male admissions funded by insurance than females. Wales is the only UK nation where that was the case.
Volume of admissions by sex and payment method
| Sex | 2019 | 2020 | 2021 | 2022 | 2023 | 2024 | 2025 |
|---|---|---|---|---|---|---|---|
| Female | |||||||
| Insured | 5,325 | 3,115 | 5,670 | 6,070 | 5,915 | 6,515 | 6,780 |
| Self-pay | 4,075 | 2,710 | 7,240 | 8,505 | 9,565 | 9,900 | 9,835 |
| Male | |||||||
| Insured | 5,730 | 3,415 | 5,710 | 6,325 | 6,655 | 7,205 | 7,285 |
| Self-pay | 3,000 | 2,400 | 5,825 | 6,910 | 7,780 | 7,575 | 7,895 |
Volume of admissions by age
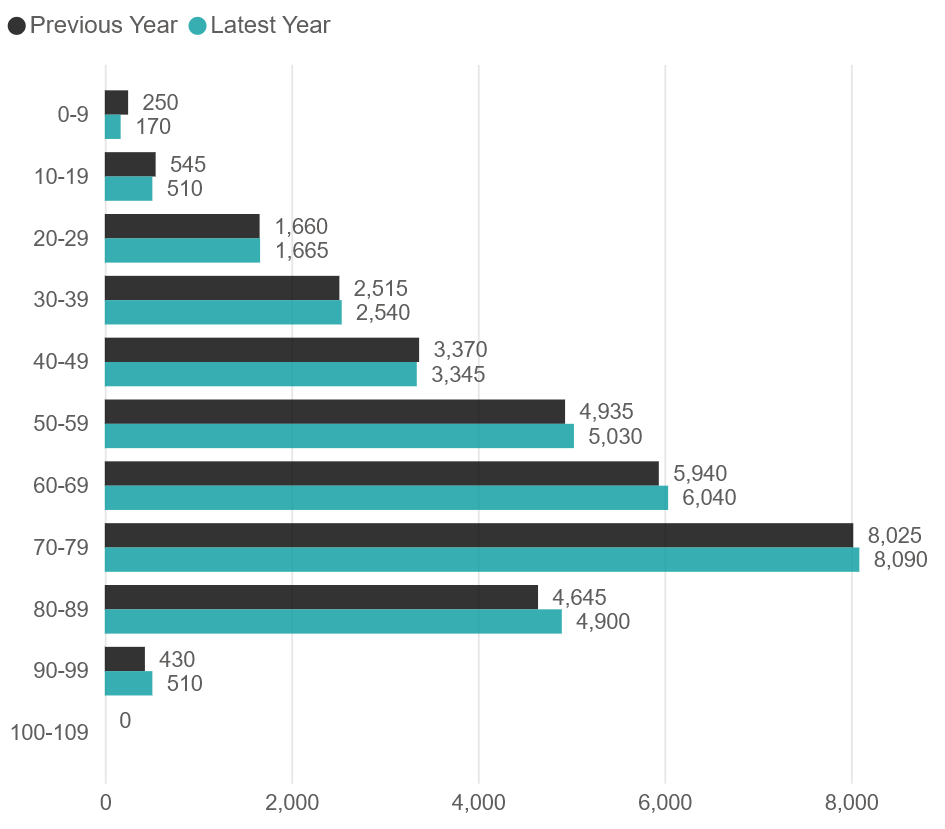
There was an increase in admissions in all age groups from 40 to 49 upwards, compared to 2024. The largest volume increase was in the 60 to 69 age group (140). The 50 to 59 age groups had the largest (2.7%) percentage increase.
The age groups from 0 to 9 up to 30 to 39 age groups all saw a decrease, with the 0 to 9s falling further in terms of volume (-80 admissions) and percentage (32%).
Important notes
All data described above is taken from PHIN’s unique, national private dataset describing discharge activity (day case and inpatient). This excludes activity outside of PHIN’s mandate from the Competition and Markets Authority, such as outpatient diagnostics, physiotherapy and mental health services.
There is a time lag between collecting, validating and processing the data we receive from hospitals before we can publish it. This can be up to 6 months after treatment has been completed, to ensure a fair process and accurate data.
Not all records submitted to PHIN contain complete data (e.g. they may miss patient sex) so there can appear to be discrepancies between totals.
Activity numbers have been rounded to the nearest 5, with percentage based on the unrounded figures.