In the latest of our quarterly updates, we use our unique, national dataset to provide a comprehensive view of the key trends in the independent healthcare sector up to, and including, the end of 2025.
The data covers private healthcare in-patient/day-case market activity and includes breakdowns by year for insured cases, ‘self-pay’, nation/English region, Top 10 procedures, demographics and proportion of healthcare admissions compared to NHS England.
(Q1 = Jan – Mar; Q2 = Apr – Jun; Q3 = Jul – Sep; Q4 = Oct – Dec)
Private healthcare sector market activity
Figures are rounded to the nearest 1,000. The total may not add as this is calculated using the actual figure then rounded.
At a glance
Changes from 2024 to 2025:
- Reported private hospital/clinic admissions were up 1% across the UK.
- Private medical insurance admissions were up 1% to new record level.
- Self-pay admissions were up slightly to reach second highest ever annual total.
- Fifth consecutive year of growth in total and insured admissions.
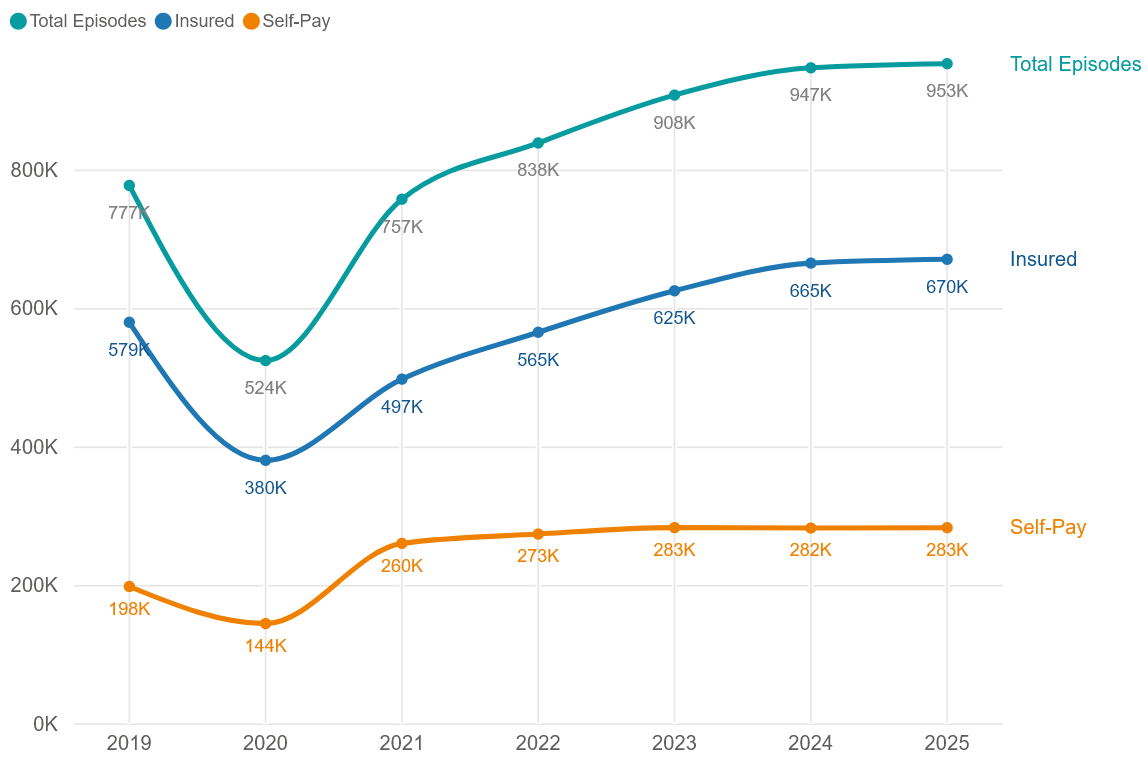
Record independent healthcare in-patient admissions in 2025
The total number of UK admissions in 2025 was 953,000 (1% above 2024) meaning the private sector had more admissions than in any previous year on record for the fourth year in a row.
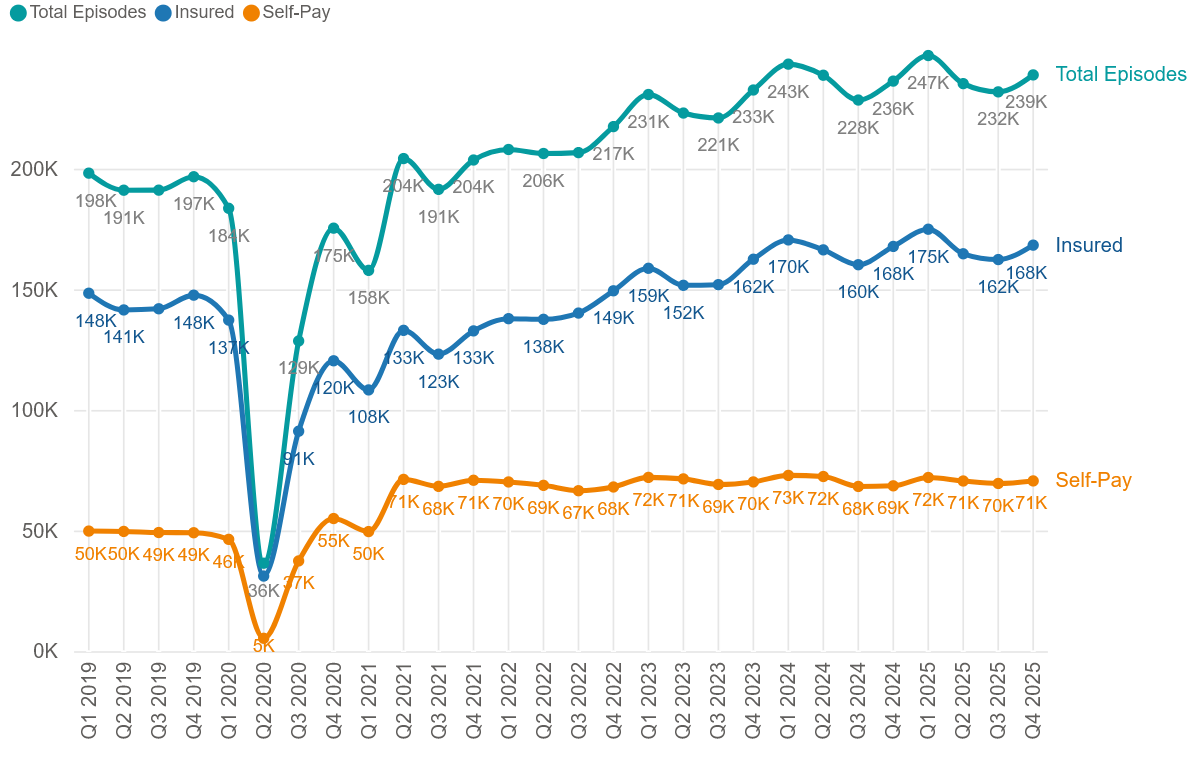
Three of the four quarters in 2025 had a record number of admissions. The remaining quarter was only beaten twice before.
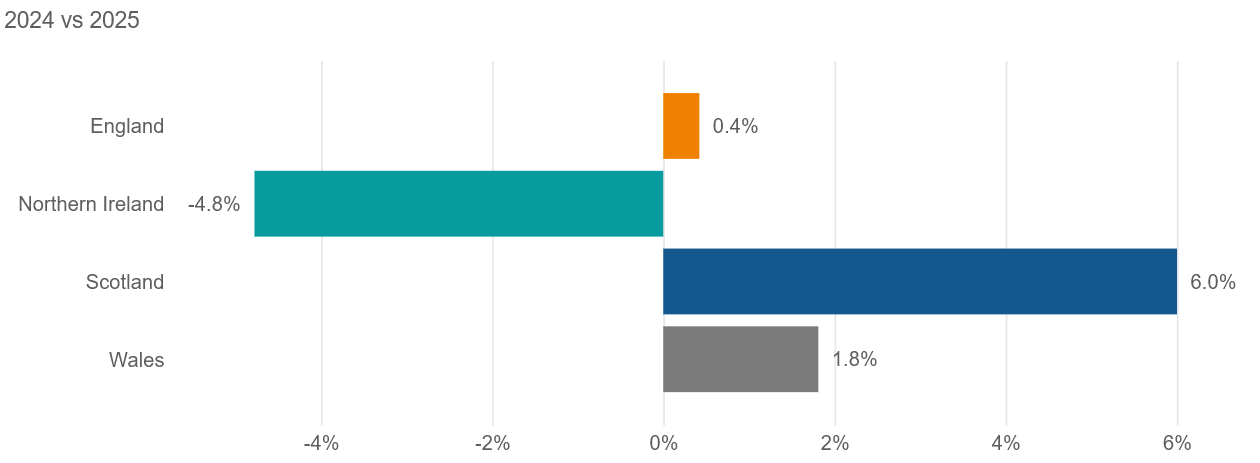
In 2025, the largest percentage growth by nation came in Scotland (6% / +3,045 admissions) followed by Wales (1.8% / +570 admissions). Although there was a smaller percentage growth in England (0.4%) it had the highest growth by volume of admission (+3,545 admissions).
The number of private admissions fell in Northern Ireland (4.8% / -1,135 admissions).
Record levels of insured and self-pay funded admissions
Insured admissions
Q1 2025 was the highest quarter ever for admissions (174,920) paid for with private medical insurance. Q3 and Q4 2025 were also higher than the equivalent quarter in 2024. Only Q2 was lower (but still above all years pre-2024).
In total, there were 6,485 more insured admissions in 2025 than in 2024 (1% increase).
Despite the overall growth, compared to 2025, the number of insured admissions using private medical insurance fell slightly in three English regions – East of England (0.7%), North East (0.2%) and the South East (3.1%) – and in Northern Ireland (11.4%).
After having a large rise (11%) in 2024, Northern Ireland’s percentage decrease was the largest of any nation or English region in 2025.
The biggest rises for insured admissions in England came in the West Midlands (9.3%). Scotland had the next largest rise (5%).
The largest rises by volume were in London (4,870) and the West Midlands (3,190). The largest decrease came in the South East (3,790).
Self-pay admissions
Self-pay admissions in 2025 were up just 0.2% (565 admissions) compared to 2024, meaning they were just 85 admissions behind 2023, the record year so far. The first two quarters of 2025 are the two highest quarters ever for admissions by self-pay.
Despite the growth 2025, admissions financed by ‘self-pay’ fell in six English regions. The biggest percentage decrease was in the North West (4.1%).
It increased in Scotland (7.2%), Wales (1.3%) and the East Midlands (7.9%), North East (5.3%) and West Midlands (6%).
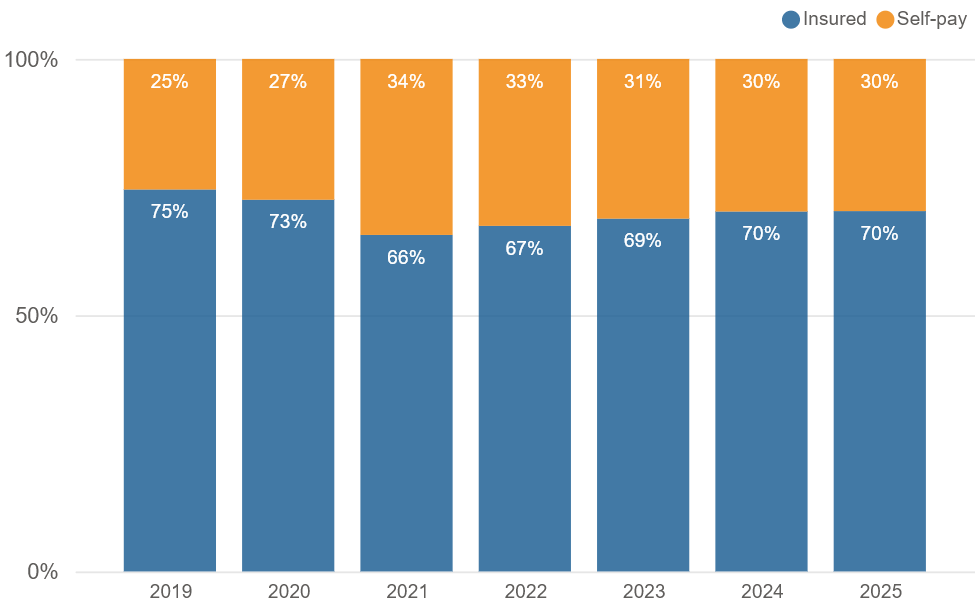
The proportion of admissions by payment method remained at 70:30 insured to self-pay.
Insured admissions by nation or English region
| Nation/region | 2023 | 2024 | 2025 |
|---|---|---|---|
| East Midlands | 24,100 | 26,240 | 26,525 |
| East of England | 69,305 | 72,600 | 72,125 |
| London | 225,320 | 243,900 | 248,770 |
| North East | 7,320 | 7,790 | 7,775 |
| North West | 41,565 | 43,480 | 44,280 |
| Northern Ireland | 11,110 | 14,385 | 12,750 |
| Scotland | 25,230 | 28,065 | 29,470 |
| South East | 118,990 | 121,790 | 118,000 |
| South West | 33,290 | 35,170 | 35,310 |
| Wales | 12,590 | 13,770 | 14,105 |
| West Midlands | 33,355 | 34,435 | 37,625 |
| Yorkshire and Humber | 22,620 | 23,200 | 23,560 |
| Total | 624,800 | 664,815 | 670,300 |
Self-pay admissions by nation or English region
| Nation/region | 2023 | 2024 | 2025 |
|---|---|---|---|
| East Midlands | 12,415 | 12,230 | 13,195 |
| East of England | 28,640 | 26,770 | 26,065 |
| London | 54,985 | 57,360 | 55,755 |
| North East | 6,495 | 6,555 | 6,905 |
| North West | 23,560 | 24,545 | 23,540 |
| Northern Ireland | 10,115 | 9,380 | 9,880 |
| Scotland | 21,870 | 22,665 | 24,305 |
| South East | 44,600 | 44,480 | 44,000 |
| South West | 27,185 | 25,495 | 24,950 |
| Wales | 17,395 | 17,695 | 17,930 |
| West Midlands | 19,200 | 18,850 | 20,140 |
| Yorkshire and Humber | 16,250 | 16,060 | 15,965 |
| Total | 282,710 | 282,080 | 282,625 |
Top 10 procedures UK
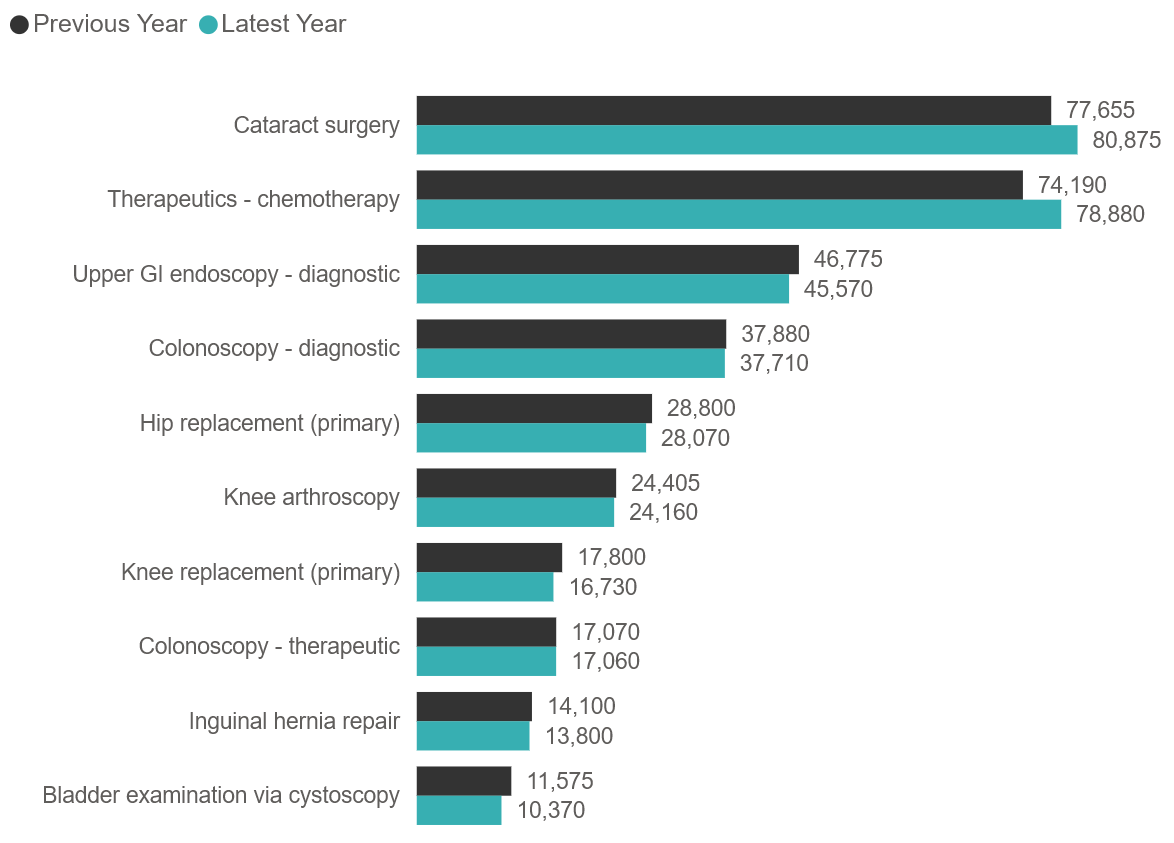
The Top 10 procedures in 2025 remained the same as in 2024, although eight of them had fewer admissions than in 2024. ‘Upper GI endoscopy – diagnostic’ and ‘Bladder examination via cystoscopy’ saw the biggest decline by volume of admissions (1,205). ‘Bladder examination via cystoscopy’ also saw the biggest percentage decrease in admissions (10.4%).
Despite the overall growth in admissions in 2025, there were also big drops outside the Top 10 including ‘Weight loss surgery – gastrectomy’ (59%) and ‘Diagnostics – blood test’ (43%).
Cataract surgery remained the most common reason to be admitted to a private hospital, but ‘Therapeutics – chemotherapy’ had the biggest admissions increase by volume (4,690) and percentage (6.3%) in the Top 10 procedures. It is worth noting that patients usually require multiple admissions for this treatment and the number of admissions they have varies depending on their health.
Outside the Top 10 many procedures saw increases, including ‘Varicose vein sclerotherapy’ (54%), ‘Breast reduction (19%) and ‘Surgical treatment for endometriosis’ (12%).
Changes in most common admissions by payment method
Although ‘Cataract surgery’ is the most popular procedure overall, it is only the third most popular for admissions funded by private medical insurance. ‘Therapeutics – Chemotherapy’ is the most popular with ‘Upper GI endoscopy – diagnostic’ and ‘Colonoscopy – diagnostic’ making up the top four.
The ‘traditional’ big three of private admissions, ‘Cataract surgery’, ‘Hip replacement (primary)' and ‘Knee replacement (primary)’ remain the three most popular admissions for self-pay patients. While they also pay for diagnostic procedures, the big difference from insured admissions comes in the form of cosmetic surgeries. ‘Breast enlargement’, ‘Breast implants’ and ‘Breast reduction’ all feature in the self-pay Top 10.
Top 10 procedures by year (2019 - 2025)
| Procedure group | 2019 | 2020 | 2021 | 2022 | 2023 | 2024 | 2025 |
|---|---|---|---|---|---|---|---|
| Bladder examination via cystoscopy | 13,140 | 8,005 | 10,335 | 11,010 | 11,585 | 11,575 | 10,370 |
| Cataract surgery | 61,140 | 45,265 | 77,790 | 77,650 | 75,665 | 77,655 | 80,875 |
| Colonoscopy - diagnostic | 30,520 | 19,620 | 28,340 | 33,015 | 36,165 | 37,880 | 37,710 |
| Colonoscopy - therapeutic | 10,615 | 7,250 | 11,625 | 13,810 | 15,665 | 17,070 | 17,060 |
| Hip replacement (primary) | 16,130 | 15,195 | 26,960 | 29,370 | 30,425 | 28,800 | 28,070 |
| Inguinal hernia repair | 9,175 | 7,545 | 12,605 | 13,545 | 13,995 | 14,100 | 13,800 |
| Knee arthroscopy | 21,385 | 14,590 | 19,935 | 22,050 | 23,025 | 24,405 | 24,160 |
| Knee replacement (primary) | 11,190 | 8,610 | 14,695 | 17,680 | 18,565 | 17,800 | 16,730 |
| Therapeutics - chemotherapy | 67,815 | 66,075 | 69,205 | 74,410 | 67,740 | 74,190 | 78,880 |
| Upper GI endoscopy - diagnostic | 38,480 | 24,325 | 37,200 | 40,175 | 43,990 | 46,775 | 45,570 |
Top 10 procedures by year (2019 - 2025) – Insurance funded
| Procedure group | 2019 | 2020 | 2021 | 2022 | 2023 | 2024 | 2025 |
|---|---|---|---|---|---|---|---|
| Bladder examination via cystoscopy | 10,960 | 6,580 | 8,255 | 8,905 | 9,340 | 9,495 | 8,510 |
| Cataract surgery | 29,100 | 18,810 | 28,770 | 30,475 | 30,815 | 32,920 | 31,220 |
| Colonoscopy - diagnostic | 26,370 | 16,755 | 23,640 | 27,640 | 31,150 | 32,810 | 32,950 |
| Colonoscopy - therapeutic | 8,825 | 5,965 | 9,365 | 11,130 | 12,990 | 14,235 | 14,390 |
| Hip replacement (primary) | 9,130 | 6,740 | 9,505 | 10,775 | 12,005 | 12,245 | 12,480 |
| Knee arthroscopy | 17,955 | 11,825 | 15,055 | 17,080 | 18,235 | 19,945 | 19,650 |
| Knee replacement (primary) | 7,015 | 4,675 | 6,235 | 7,690 | 8,690 | 8,695 | 8,580 |
| Therapeutics - chemotherapy | 64,765 | 63,130 | 66,115 | 70,780 | 64,135 | 70,215 | 75,350 |
| Therapeutics - intravenous drug infusion | 6,370 | 5,215 | 6,425 | 7,795 | 7,480 | 9,120 | 9,985 |
| Upper GI endoscopy - diagnostic | 33,095 | 20,385 | 30,745 | 33,785 | 37,870 | 40,700 | 39,750 |
Top 10 procedures by year (2019 - 2025) – Self-pay funded
| Procedure group | 2019 | 2020 | 2021 | 2022 | 2023 | 2024 | 2025 |
|---|---|---|---|---|---|---|---|
| Breast enlargement | 8,155 | 3,580 | 6,950 | 5,830 | 5,620 | 5,690 | 5,350 |
| Breast implants | 4,275 | 3,265 | 4,765 | 4,920 | 5,345 | 5,515 | 5,705 |
| Breast reduction | 3,090 | 1,720 | 4,040 | 4,275 | 4,275 | 4,030 | 4,375 |
| Cataract surgery | 32,040 | 26,455 | 49,020 | 47,180 | 44,845 | 44,735 | 49,655 |
| Colonoscopy - diagnostic | 4,155 | 2,865 | 4,700 | 5,375 | 5,015 | 5,070 | 4,760 |
| Hip replacement (primary) | 7,000 | 8,455 | 17,455 | 18,595 | 18,425 | 16,555 | 15,590 |
| Inguinal hernia repair | 3,230 | 3,275 | 6,290 | 6,655 | 7,075 | 6,710 | 6,100 |
| Knee arthroscopy | 3,430 | 2,760 | 4,880 | 4,970 | 4,790 | 4,460 | 4,510 |
| Knee replacement (primary) | 4,175 | 3,935 | 8,455 | 9,990 | 9,870 | 9,110 | 8,150 |
| Upper GI endoscopy - diagnostic | 5,380 | 3,935 | 6,455 | 6,390 | 6,120 | 6,080 | 5,820 |
Active consultants in private healthcare by year
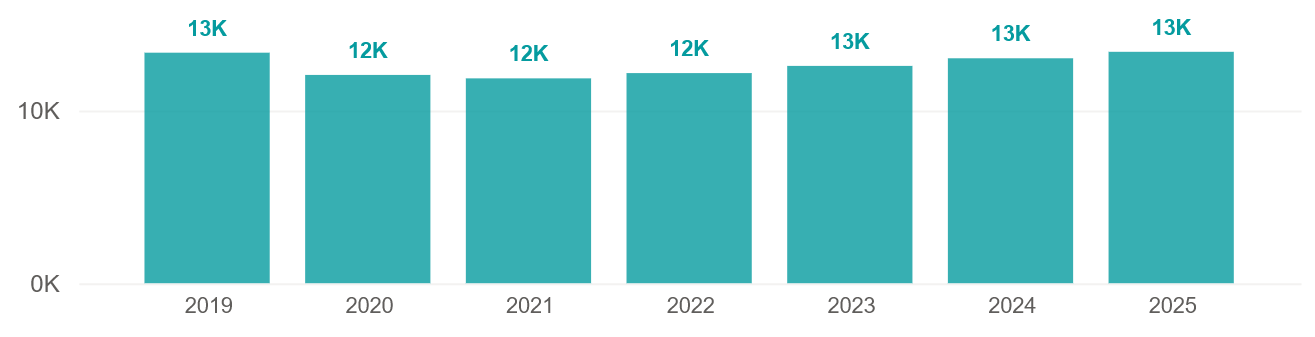
The number of active consultants was at the highest ever in 2025 reaching nearly 13,400. This was a 2.9% increase on 2024.
The number of consultants active in private healthcare regularly fluctuates as new consultants start working in the private sector, and existing ones go on sabbatical, stop working privately, or retire.
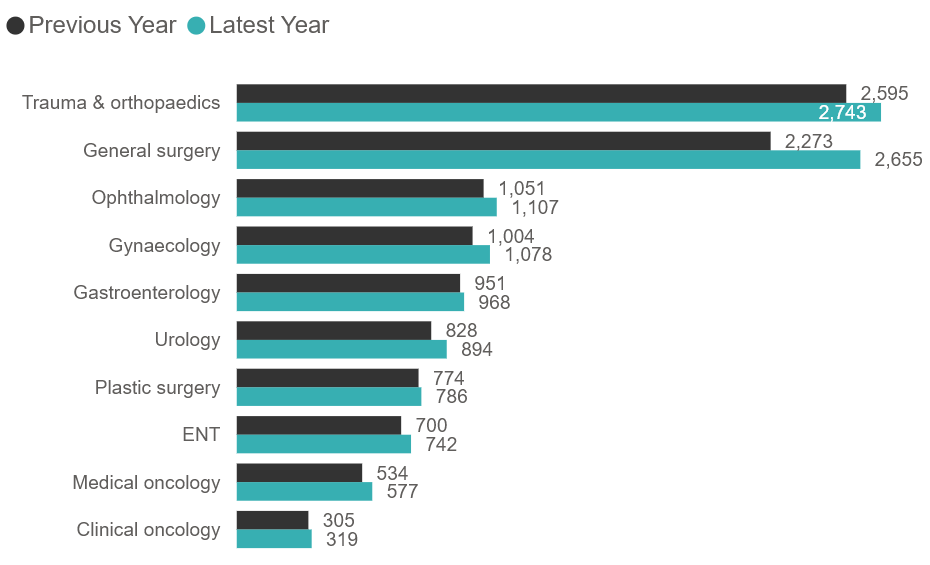
Every private healthcare specialty in the Top 10 saw an increase in consultants working in it. The largest volume and percentage increase in active consultants in the Top 10 procedure groups in 2025 was in ‘General Surgery’ with an extra 382 consultants (16.8%). ‘General Surgery’ also had the biggest increase in 2025. Trauma & orthopaedics remains the specialty with the most active consultants in the private sector.
Patient demographics
Payment method
There was an increased number of insured admissions for both sexes in 2025 compared to 2024. Female insured funded admissions increased 0.6% and male admissions 1.0%.
Reported female self-pay funded admissions fell 0.9% and male admissions were down 0.6%. There was an overall rise in self-pay admissions despite these declines as some data submitted to PHIN did not include the patient’s sex.
Volume of admissions by sex and payment method
| Sex | 2019 | 2020 | 2021 | 2022 | 2023 | 2024 | 2025 |
|---|---|---|---|---|---|---|---|
| Female | |||||||
| Insured | 307,345 | 203,020 | 264,005 | 296,325 | 329,635 | 349,745 | 351,995 |
| Self-pay | 120,645 | 83,340 | 152,665 | 158,955 | 163,555 | 165,745 | 164,030 |
| Male | |||||||
| Insured | 270,455 | 176,225 | 232,050 | 265,405 | 293,625 | 313,625 | 316,735 |
| Self-pay | 76,175 | 60,005 | 105,575 | 113,075 | 116,995 | 114,285 | 113,375 |
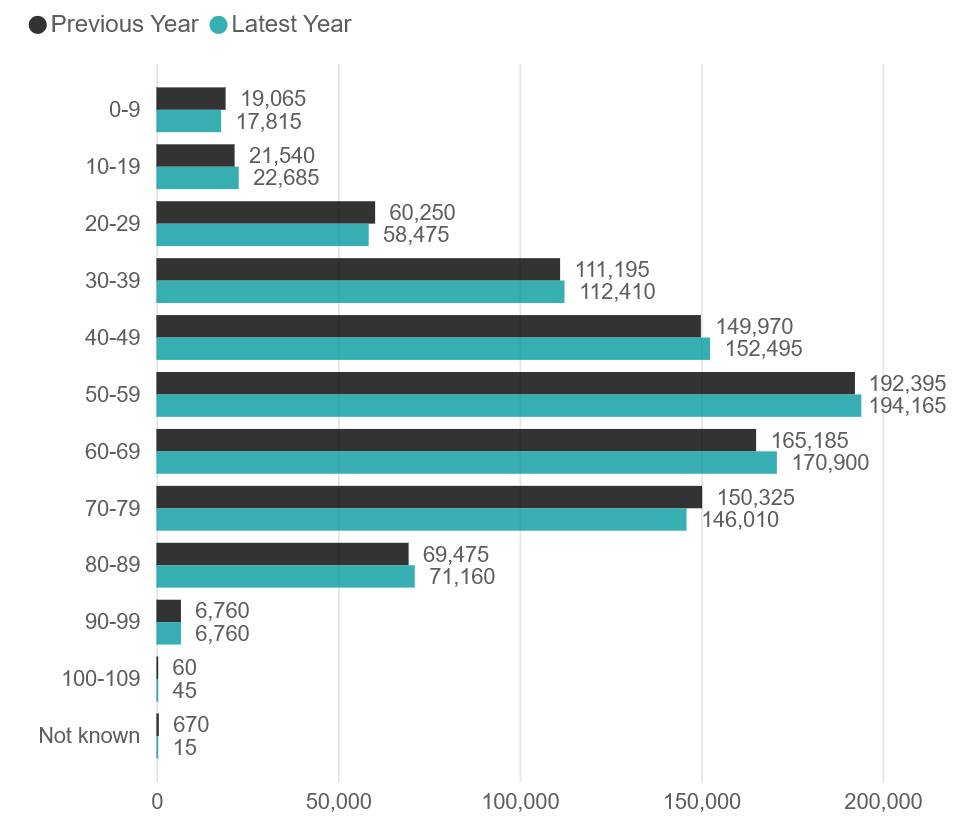
Volume of admissions by age
There was an increase in admissions in most age groups, compared to 2024. The largest volume increase was in the 60 to 69 age group (5,715) followed by the 40 to 49 age group (2,525). The largest percentage increase was in the 10-19 (5.3%) age group.
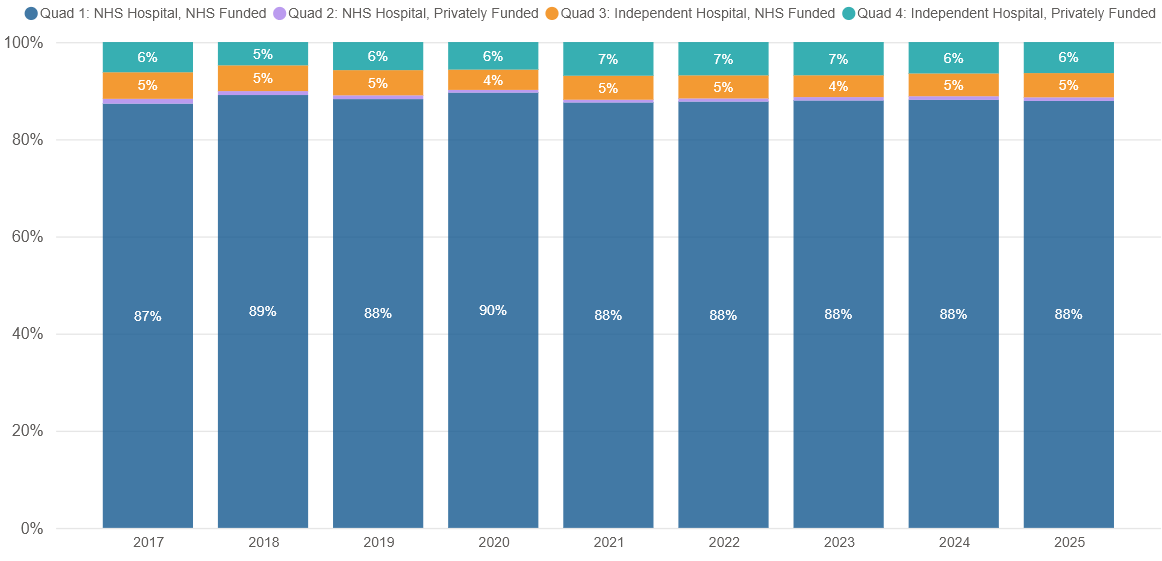
Private healthcare as proportion of English admissions
Despite being another record year for private hospital/clinic admissions, the proportion of the total day-case/in-patient admissions conducted in the UK remained the same.
The percentage of admissions funded by the NHS, but conducted in private hospitals/clinics, has also remained consistent over the past nine years, with a slight dip in 2020.
In 2025 the percentage of admissions in the NHS was the highest since the pandemic, but still slightly lower than pre-pandemic levels.
Important notes
All data described above is taken from PHIN’s unique, national private dataset describing discharge activity (day case and inpatient). This excludes activity outside of PHIN’s mandate from the Competition and Markets Authority , such as outpatient diagnostics, physiotherapy and mental health services.
There is a time lag between collecting, validating and processing the data we receive from hospitals before we can publish it. This can be up to 6 months after treatment has been completed, to ensure a fair process and accurate data.
Not all records submitted to PHIN contain complete data (e.g. they may miss patient sex) so there can appear to be discrepancies between totals.
Activity numbers have been rounded to the nearest 5, with percentage based on the unrounded figures.