In the latest of our quarterly updates, we use our unique, national dataset to provide a comprehensive view of the key trends in the independent healthcare sector up to, and including, the end of 2025.
The data covers private healthcare in-patient/day-case market activity and includes breakdowns by year for insured cases, ‘self-pay’, Top 10 procedures and demographics.
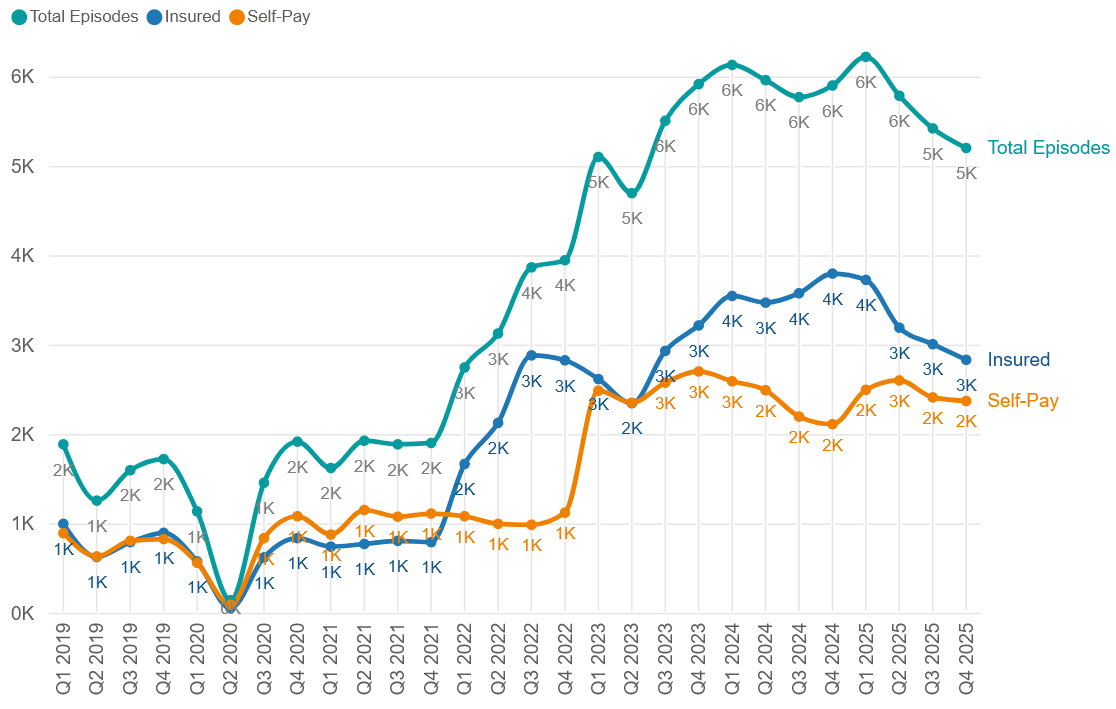
Private healthcare sector market activity
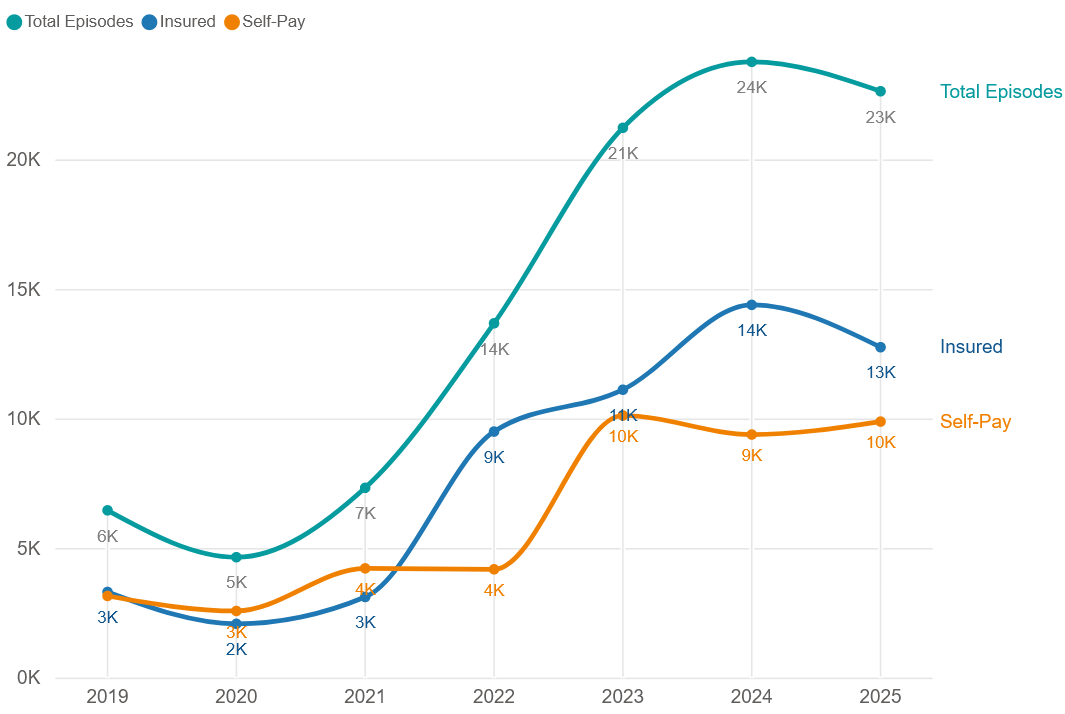
* Figures are rounded to the nearest 1,000. The total may not add as this is calculated using the actual figure then rounded.
(Q1 = Jan – Mar; Q2 = Apr – Jun; Q3 = Jul – Sep; Q4 Oct – Dec)
At a glance
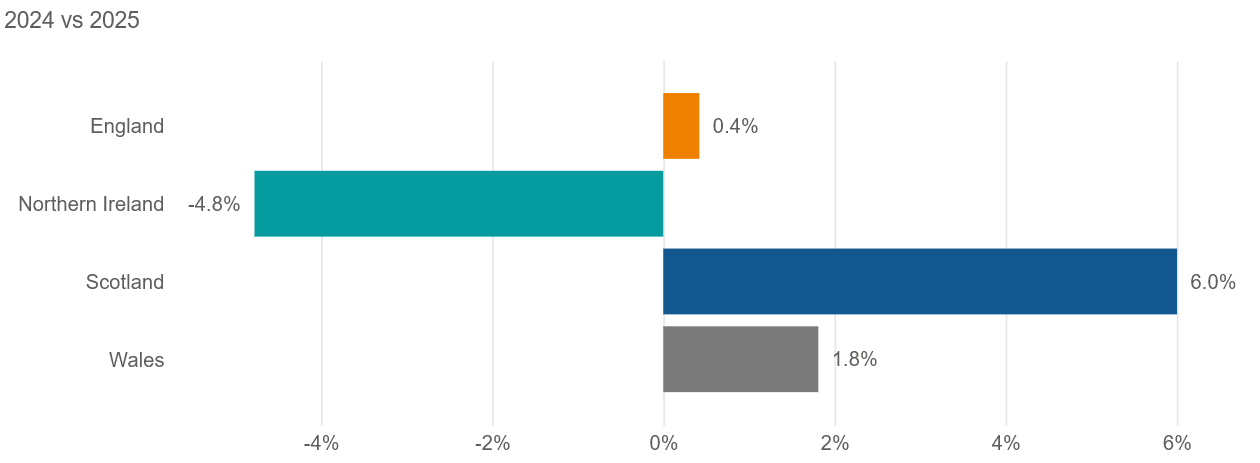
Changes from 2024 to 2025:
- Reported private hospital/clinic admissions were down 5%.
- Private medical insurance admissions were down 11%.
- Self-pay admissions were up 5% to reach second highest ever annual total.
- First time admissions have dropped since 2020.
Declining insured admissions mean overall reduction
The total number of private hospital admissions in 2025 was 5,200 (5% below 2024) meaning that the private sector saw a reduced number of admissions for the first time since 2020.
This was despite Q1 (Jan-Mar) 2025 being the highest quarter on record for admissions.
The number of private admissions fell in Northern Ireland (5% / -1,135 admissions).
Record levels of insured and self-pay funded admissions
Insured admissions
Despite the number of admissions paid for with private medical insurance falling in 2025, it was still the second highest year (12,750).
In total, there were 1,635 fewer insured admissions in 2025 than in 2024 (11% decrease).
After having a large rise (11%) in 2024, Northern Ireland’s percentage decrease was the largest of any UK nation or English region in 2025.
Self-pay admissions
Self-pay admissions in 2025 were up 5% (500 admissions) compared to 2024, meaning they were just 235 admissions behind 2023, the record year so far.
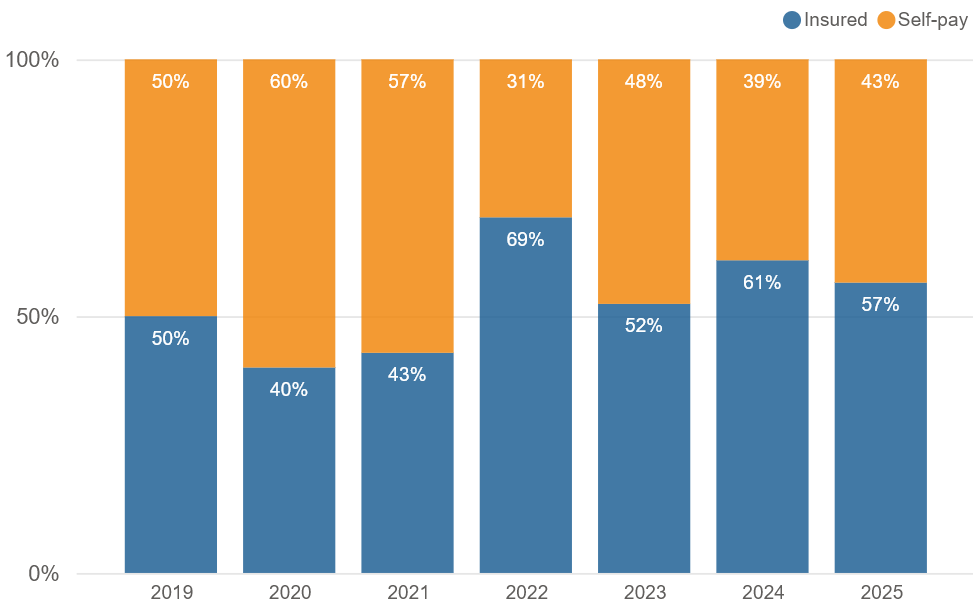
The proportion of admissions by paid for with insurance fell to 57%, with self-pay rising to 43%.
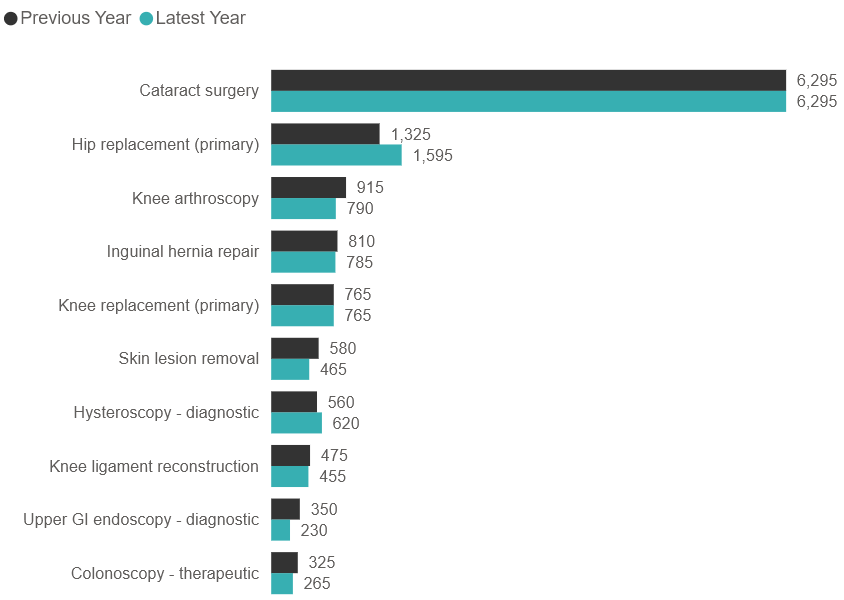
Top 10 procedures in Northern Ireland
The Top 10 procedures in 2025 remained the same as in 2024, although many of them occupy different positions.
‘Cataract surgery’ remains at number 1, with the same amount of reported admissions (6,295) as in 2024. ‘Knee replacement (primary) also maintained the same level (765).
There were increases in admissions for ‘Hip replacement (primary)’ which was up 20% and ‘Hysteroscopy – diagnostic’ which was up 11%. The remaining procedures all had fewer admissions than in 2024.
Changes in most common admissions by payment method
‘Cataract surgery’ is the most popular procedure for either payment method.
There are three procedures that only appear in the PMI funded Top 10. These are all known as ‘scopes’. They are ‘Hysteroscopy – diagnostic’ (a gynaecology scope) and ‘Upper GI endoscopy – diagnostic’ and ‘Colonoscopy – therapeutic’ (which are gastroenterology scopes).
For self-pay the three different procedures are ‘Adenoidectomy’, ‘Knee ligament reconstruction’ and ‘Spinal decompression (lumbar)’. Adenoidectomy is commonly conducted on under 10s, and knee ligament procedures include Anterior cruciate ligament (ACL) and this is also more likely in children and younger adults. In contrast, ‘Spinal decompression (lumbar)’ is most often for 50-70 year olds.
Top 10 procedures by year (2019 - 2025)
| Procedure group | 2019 | 2020 | 2021 | 2022 | 2023 | 2024 | 2025 |
|---|---|---|---|---|---|---|---|
| Cataract surgery | 1,055 | 1,230 | 1,605 | 1,400 | 1,620 | 6,295 | 6,295 |
| Colonoscopy - therapeutic | 135 | 195 | 265 | 260 | 225 | 325 | 265 |
| Hip replacement (primary) | 180 | 180 | 320 | 315 | 405 | 1,325 | 1,595 |
| Hysteroscopy - diagnostic | 60 | 85 | 135 | 170 | 205 | 560 | 620 |
| Inguinal hernia repair | 110 | 185 | 280 | 295 | 345 | 810 | 785 |
| Knee arthroscopy | 165 | 270 | 375 | 475 | 445 | 915 | 790 |
| Knee ligament reconstruction | 175 | 155 | 250 | 290 | 345 | 475 | 455 |
| Knee replacement (primary) | 110 | 120 | 195 | 295 | 365 | 765 | 765 |
| Skin lesion removal | 10 | 60 | 170 | 160 | 205 | 580 | 465 |
| Upper GI endoscopy - diagnostic | 90 | 115 | 235 | 290 | 265 | 350 | 230 |
Top 10 procedures by year (2019 - 2025) – Insurance funded
| Procedure group | 2019 | 2020 | 2021 | 2022 | 2023 | 2024 | 2025 |
|---|---|---|---|---|---|---|---|
| Cataract surgery | 190 | 150 | 190 | 190 | 235 | 3,895 | 3,750 |
| Colonoscopy - therapeutic | 115 | 155 | 215 | 190 | 170 | 255 | 225 |
| Hip replacement (primary) | 60 | 65 | 115 | 115 | 140 | 425 | 365 |
| Hysteroscopy - diagnostic | 55 | 75 | 115 | 155 | 190 | 505 | 570 |
| Inguinal hernia repair | 60 | 85 | 85 | 105 | 130 | 480 | 460 |
| Knee arthroscopy | 80 | 135 | 179 | 250 | 225 | 615 | 505 |
| Knee replacement (primary) | 40 | 45 | 60 | 115 | 135 | 265 | 215 |
| Skin lesion removal | 0 | 35 | 90 | 70 | 105 | 260 | 260 |
| Tonsillectomy | 35 | 30 | 35 | 60 | 115 | 345 | 250 |
| Upper GI endoscopy - diagnostic | 70 | 90 | 175 | 220 | 205 | 275 | 190 |
Top 10 procedures by year (2019 - 2025) – Self-pay funded
| Procedure group | 2019 | 2020 | 2021 | 2022 | 2023 | 2024 | 2025 |
|---|---|---|---|---|---|---|---|
| Adenoidectomy | 15 | 20 | 40 | 65 | 145 | 125 | 100 |
| Cataract surgery | 865 | 1,080 | 1,415 | 1,210 | 1,385 | 2,400 | 2,540 |
| Hip replacement (primary) | 115 | 120 | 200 | 200 | 260 | 905 | 1,230 |
| Inguinal hernia repair | 50 | 100 | 190 | 190 | 215 | 330 | 325 |
| Knee arthroscopy | 85 | 135 | 200 | 225 | 215 | 300 | 290 |
| Knee ligament reconstruction | 125 | 120 | 195 | 215 | 235 | 275 | 305 |
| Knee replacement (primary) | 65 | 80 | 130 | 180 | 230 | 500 | 550 |
| Skin lesion removal | 0 | 25 | 80 | 90 | 105 | 315 | 205 |
| Spinal decompression (lumbar) | 40 | 50 | 85 | 50 | 85 | 105 | 160 |
| Tonsillectomy | 15 | 25 | 40 | 50 | 85 | 135 | 145 |
Active consultants in private healthcare by year
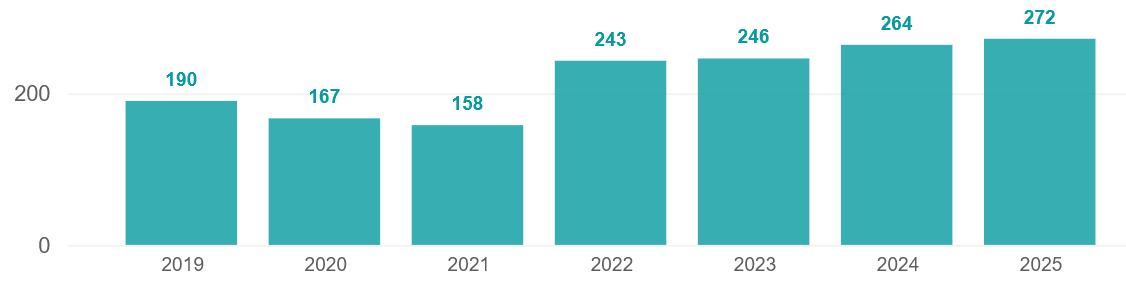
The number of active consultants in Northern Ireland was at the highest ever in Q1 2025 reaching 237. However, the number declined for the rest of the year and there was one consultant less than 2024 in total.
The number of consultants active in private healthcare regularly fluctuates as new consultants start working in the private sector, and existing ones go on sabbatical, stop working privately, or retire.
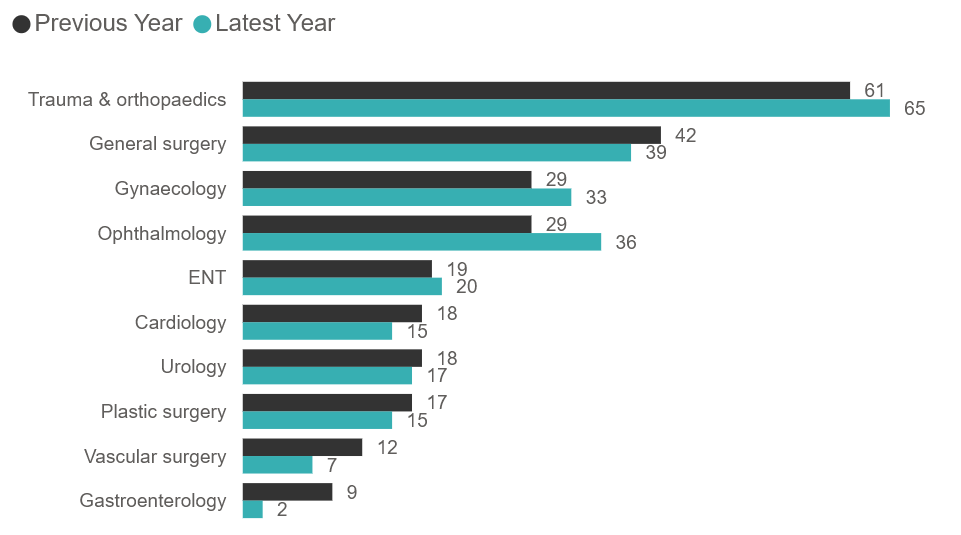
There were an additional four consultants working in ‘Gynaecology’ and ‘Trauma & orthopaedics’ which was the largest increase of any of the Top 10 specialties. The largest decline came in ‘Gastroenterology’ where there were seven fewer consultants than in 2024.
Patient demographics
Payment method
There was a reduced number of insured admissions for both sexes in 2025 compared to 2024. Female insured funded admissions reduced by 8.5% and male admissions 14.6%.
Reported female self-pay funded admissions rose by 6% and male admissions were up by 6.6%.
Volume of admissions by sex and payment method
| Sex | 2019 | 2020 | 2021 | 2022 | 2023 | 2024 | 2025 |
|---|---|---|---|---|---|---|---|
| Female | |||||||
| Insured | 1,615 | 1,000 | 1,535 | 3,950 | 6,025 | 7,805 | 7,140 |
| Self-pay | 1,550 | 1,255 | 2,020 | 1,990 | 5,325 | 5,100 | 5,405 |
| Male | |||||||
| Insured | 1,690 | 1,075 | 1,570 | 3,735 | 5,080 | 6,570 | 5,610 |
| Self-pay | 1,600 | 1,315 | 2,195 | 2,190 | 4,720 | 4,160 | 4,435 |
Volume of admissions by age
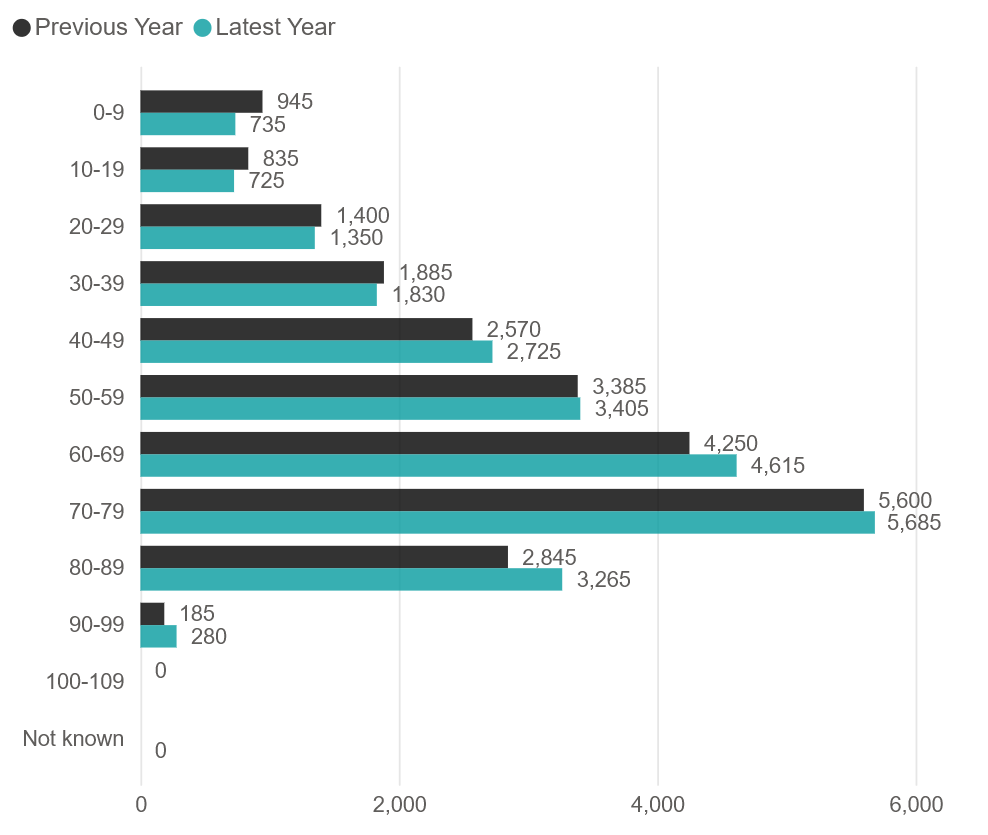
There were fewer admissions for all age groups except the 40-49 and 90-99 year olds. The 60-69 age group stayed the same.
The biggest volume decrease was in the 70-79 age group and the biggest percentage decrease was in the 0-9s.
Important notes
All data described above is taken from PHIN’s unique, national private dataset describing discharge activity (day case and inpatient). This excludes activity outside of PHIN’s mandate from the Competition and Markets Authority, such as outpatient diagnostics, physiotherapy and mental health services.
There is a time lag between collecting, validating and processing the data we receive from hospitals before we can publish it. This can be up to 6 months after treatment has been completed, to ensure a fair process and accurate data.
Not all records submitted to PHIN contain complete data (e.g. they may miss patient sex) so there can appear to be discrepancies between totals.
Activity numbers have been rounded to the nearest 5, with percentage based on the unrounded figures.