Here we look at the key trends happening in the sector for the end of 2021, as seen from our unique, national dataset.
We look at what’s happening in the private healthcare market, with a focus on self-pay where growth has continued.
Total activity is back to pre-pandemic levels
%20(1).png)
In the latest available quarter (October to December 2021) providers reported almost 198,000 private patient admissions. This shows activity back to pre-pandemic levels for the last comparable quarter in 2019. This follows a slight fall in activity in quarter 3 (July to October) of 2021.
Self-pay continues to drive growth
In line with our last update in March, the latest trends continue to show significant growth in the self-pay market.
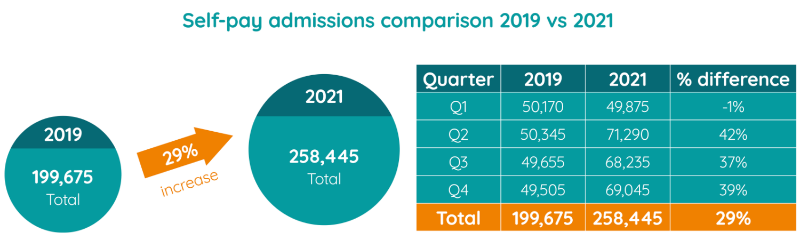
The self-pay market continues to grow comparative to before the pandemic. For the latest reported quarter there were 69,000 self-pay admissions, which represents a 39% rise compared to the same quarter in 2019. Looking across the whole of the year, 2021 saw a 29% rise in self-pay admissions compared with 2019.
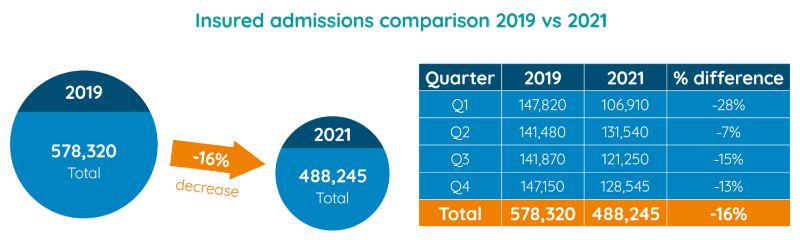
At the same time, the number of people receiving treatment on an insured basis continues to be below 2019 levels. In the latest reported quarter insured activity is 13% below the comparative period in 2019. Looking across the whole of the year, insured activity was down 16% in 2021 compared with 2019.
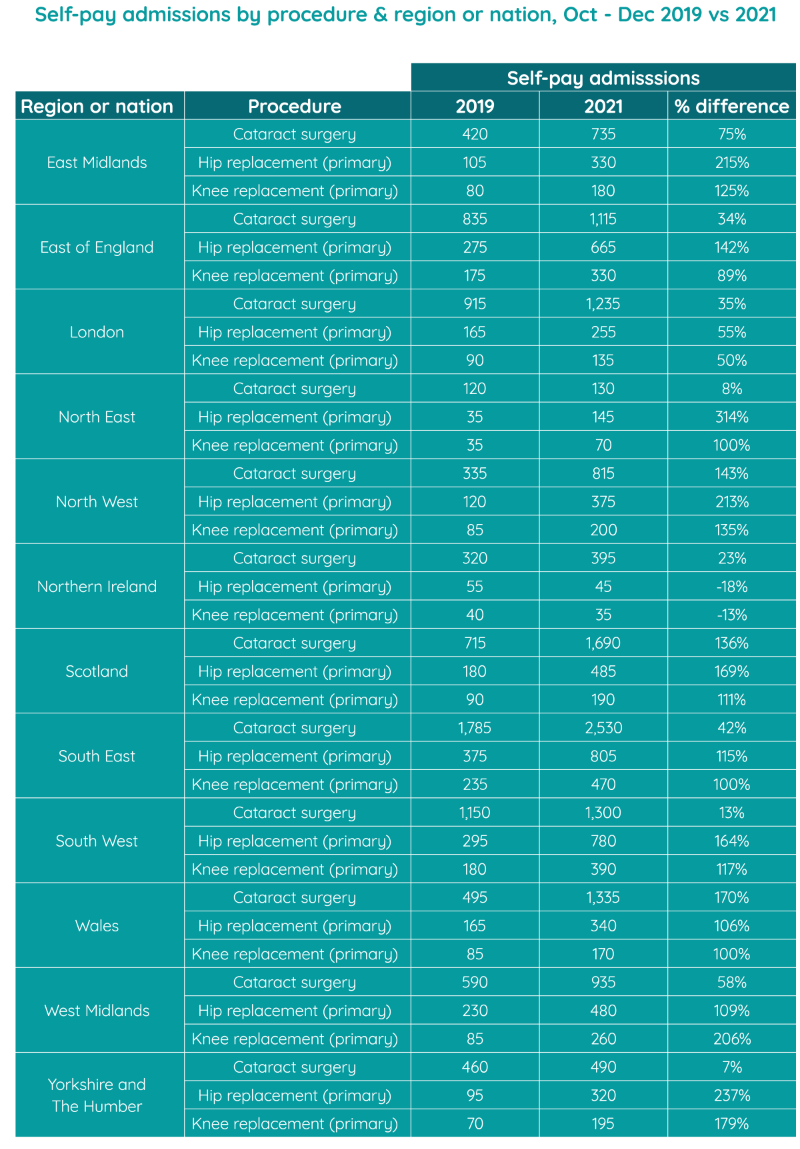
Self-pay in the regions
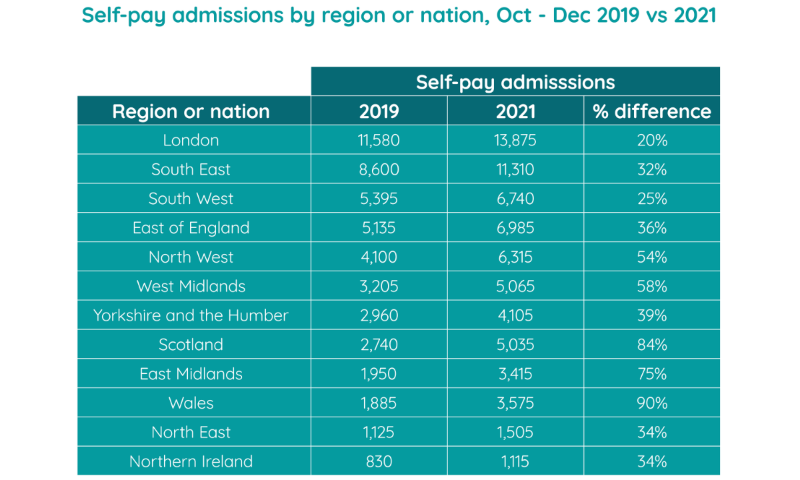
London continues to be the most active self-pay market, with almost 14,000 self-pay admissions between October and December 2021, with the South East next with just over 11,000. While in previous quarters London saw growth under 10% in the number of people self-paying, the latest reported data indicates a 20% rise compared with 2019.
Wales (90% rise compared to 2019), Scotland (84%) and the East Midlands (75%) continue to experience significant growth in the self-pay market.
Self-pay trends for common procedures
When delving into the data further, it becomes evident that certain common procedures are the primary drivers of the growth in the self-pay market. This continues to be the case for the latest reported trends.
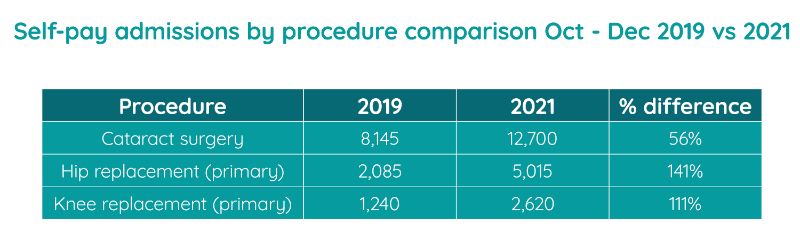
People seeking cataract surgery on a self-pay basis was up to 12,700 in the latest reported quarter, an increase of 56% on the same quarter in 2019. Although activity volumes are lower for hip and knee replacements compared with cataract surgery, both continue to see triple digit growth of 141% and 111% respectively.
Below we have provided a breakdown of self-pay activity across the different nations and regions of the UK, which show interesting variations at a local level. In some cases the percentage difference is significant, although in most cases these are based on smaller absolute volumes.
Active consultants in private healthcare
While we are seeing private activity back to pre-pandemic levels, and particularly strong growth in the self-pay market, the number of consultants actively treating private patients continues to be lower.
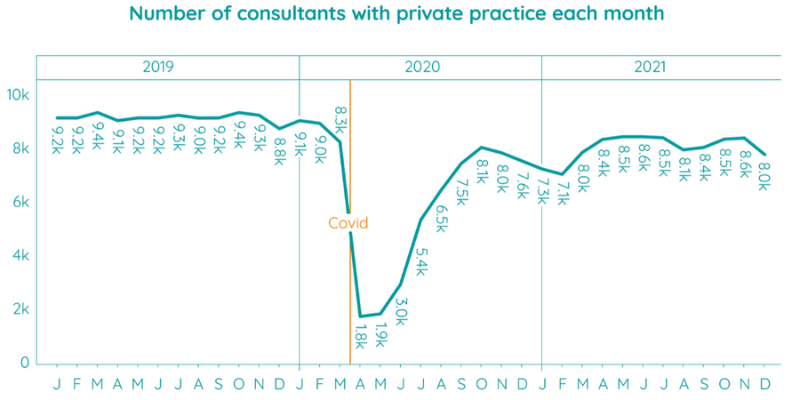
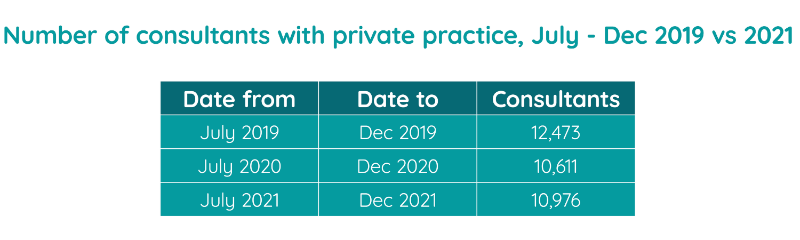
When comparing the number of consultants with a known private admission from July to December 2021 to the same period in 2019, we see a drop from 12,473 to 10,976. This represents a 12% reduction in active consultants in private healthcare between these two periods.
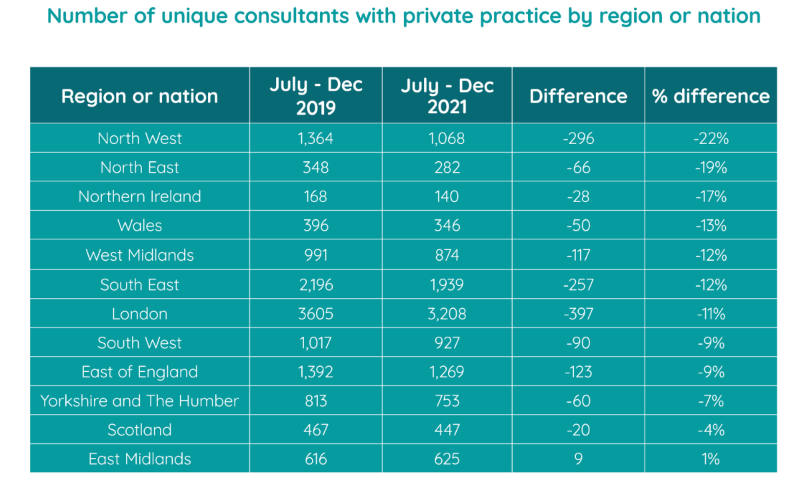
The reduction of consultants continues to be pronounced in certain regions, particularly in the North of England. The North West and North East both have around 20% fewer active consultants compared to 2019. The East Midlands is the only area of the country with a higher number of active consultants compared with 2019.
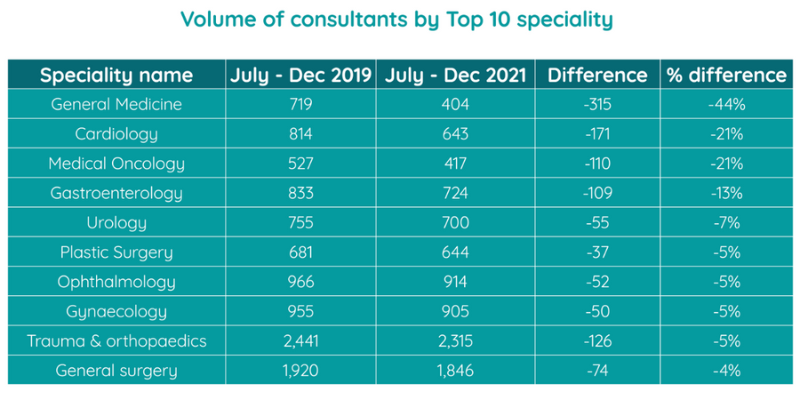
There are significant differences when viewed by consultant specialty also. General surgery and trauma and orthopaedics are the two specialties with the highest volume of active consultants and have also seen the smallest percentage drop since 2019, with 4% and 5% respectively. At the other end of the scale, general medicine has seen a 44% fall in active consultants compared to the same period in 2019.
Important notes
All data described above taken from PHIN’s unique, national private dataset describing admitted activity (day case and inpatient). This excludes activity outside of PHIN’s mandate from the Competition and Markets Authority, such as outpatient diagnostics and mental health.
Activity numbers have been rounded to the nearest 5, with percentage based on the rounded figures.
 (1).png)