We use our unique, national dataset to look at the key trends happening in the private healthcare sector for Q2 (April to June) 2022.
Self-pay continued to be an important factor in the private healthcare market. There was also a large increase in the number of consultants working across the Top 10 specialties, particularly general medicine (137%) and general surgery (63%).
Cataracts continued to be the most frequently conducted self-pay procedure, but hip replacement, knee replacement and inguinal hernia repair all had large increases.
Market activity
.png)
* Figures are rounded to the nearest 1,000. The total may not add as this is calculated using the actual figure then rounded.
In the latest available quarter (April to June 2022) providers reported similar levels of private patient admissions to the previous two quarters. Although slightly down on Q1 (January to March) 2022, at almost 200,000, it is higher than the level of activity reported for (pre-pandemic) quarter 2 in 2019.
Self-pay continues to be popular
Although below the figures for the past year, self-pay figures continue to be at a high level and well above (33%) the equivalent figure for Q2 2019.
After rising to a post-pandemic lockdown high in Q1 2022, the number of people receiving treatment on an insured basis was lower and at a similar level to Q4 2021. In Q2 2022, insured activity was 8% below the comparative period in 2019, but at a similar level to Q2 2021.
NHS private patient services activity in both self-pay and insured cases continued to be below pre-pandemic activity levels. Self-pay was down 27% and insured cases down 46% from Q2 2019.
Self-pay in the regions
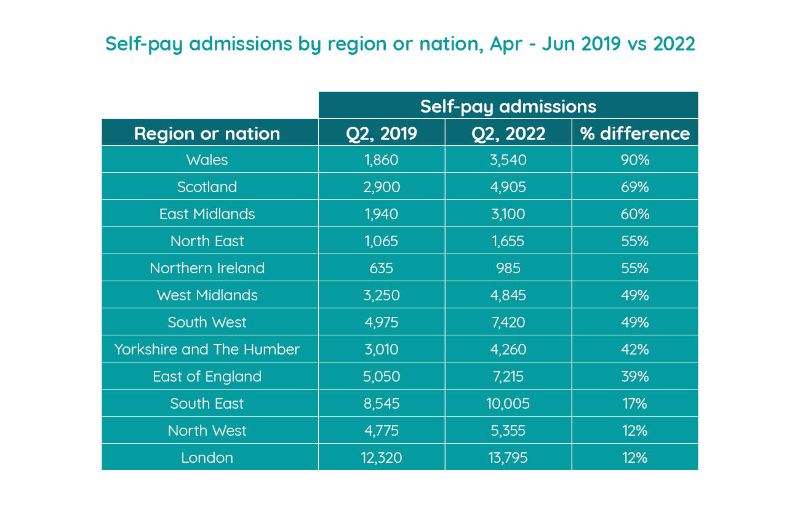
London, the South East and South West were again the most active self-pay market in terms of volume, with over 13,795; 10,005; and 7,420 admissions respectively between April and June 2022. London had the joint lowest growth rate (alongside the North West), and the South East also had a lower growth rate (17%) than the majority of nations/regions. In contrast, the South West experienced growth of 49%.
Wales continued to see high increases in self-pay admissions (90%) in the quarter and also had an increase in insured admissions (21%).
Northern Ireland had a 55% increase in self-pay admissions and was also the nation/region with the highest growth in insured admissions (28%), though totals are lower in both cases than other nations/regions.
Scotland once again saw a strong growth in self-pay admissions (up 69%), but its insured admissions were down 10% on the equivalent pre-pandemic months.
Self-pay trends for common procedures
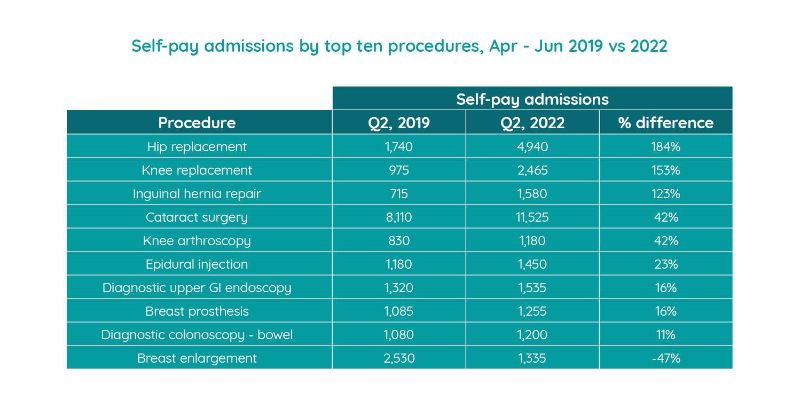
By volume cataract surgery is once again the largest area of activity for self-pay procedures (up 42% on Q2 2019). However, in terms of growth, hip replacement (184%), knee replacement (153%) and inguinal hernia repair (123%) procedures had the highest increase (each with triple digit increases).
The other procedures making up the Top 10 had lower growth rates. Breast enlargement was the only procedure in the Top 10 to show a fall (-47%).
Active consultants in private healthcare
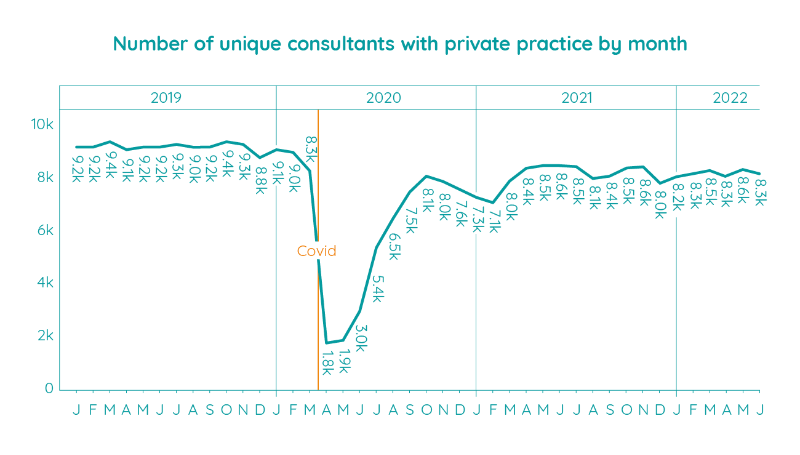
The number of consultants actively treating private patients was largely consistent with Q1 2022. May equalled the joint highest number of active consultants since the pandemic began. This is a peak reached only twice before (in June 2021 and November 2021). However, May’s total was still 600 below the same month in 2019.
Volume of consultants by Top 10 specialty
.jpg)
Compared to the same 6 month period in 2020, there was an increase in the number of active consultants for each of the Top 10 specialties in the latest period. This was most pronounced for general medicine (up 137%) and general surgery (up 63%).
Trauma and orthopaedics had the highest volume of consultants of the Top 10 specialties, and it had the lowest growth rate (29%).
Important notes
All data described above taken from PHIN’s unique, national private dataset describing admitted activity (day case and inpatient). This excludes activity outside of PHIN’s mandate from the Competition and Markets Authority, such as outpatient diagnostics and mental health.
There is a time lag between collecting, validating and processing the data we receive from hospitals before we can publish it. This can be up to 6 months after treatment has been completed, to ensure a fair process and accurate data.
Activity numbers have been rounded to the nearest 5, with percentage based on the unrounded figures.