Our latest data on private activity in the UK shows a slow start to 2021.
While the signs at the end of last year pointed towards a potential recovery of private healthcare, the rise in hospital admissions of Covid-19 patients at the beginning of the year, along with the nation-wide lockdown, seems to have led to a stagnation of private elective treatment.
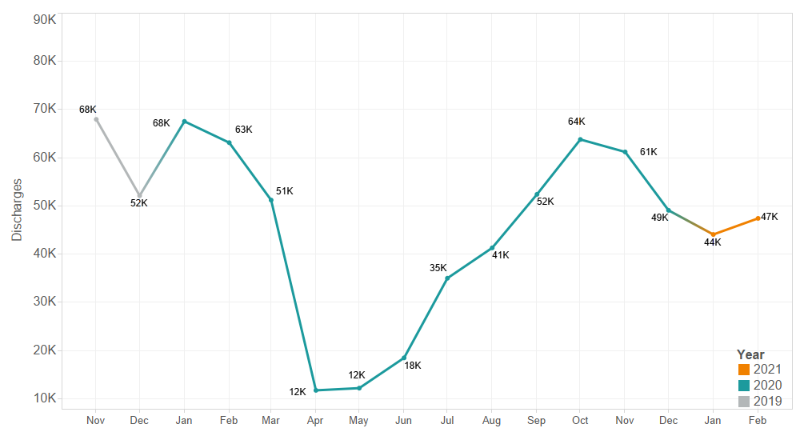
The number of people receiving privately funded acute treatment remained fairly consistent from December 2020, with 44,000 episodes of care in January compared with 49,000 in December. February saw an increase in activity to 47,000.
Estimated count of private episodes
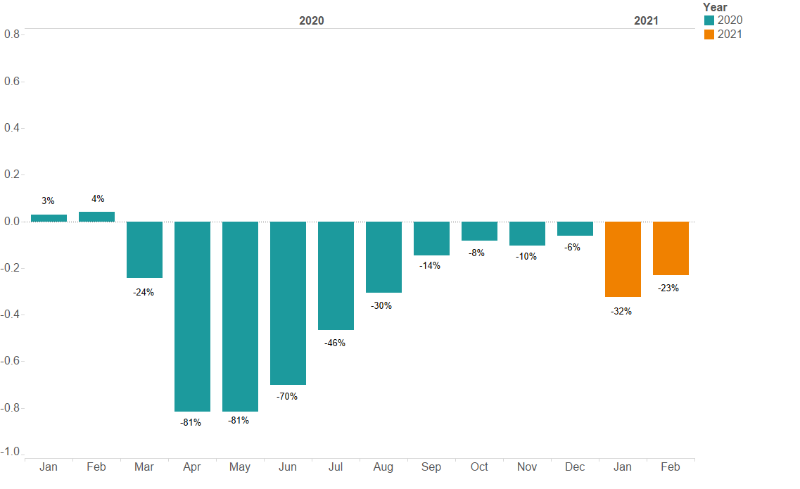
However, when looking at a year on year trend, this January is down almost a third (32%) when compared to January 2020. February 2021 was 23% lower than in the same month in 2020, before the pandemic took hold in the UK.
Estimated change in activity
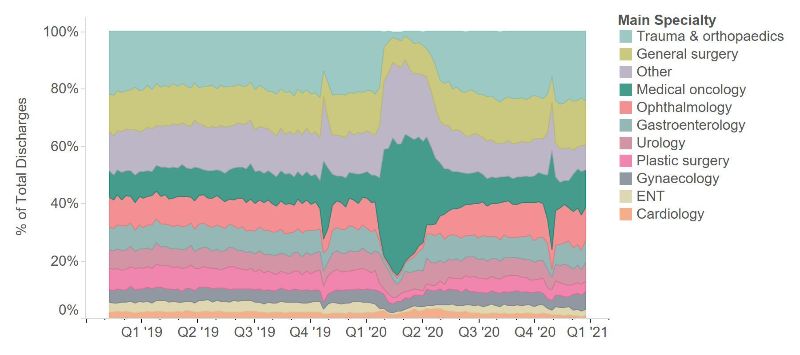
The specialty split shows few significant changes in market share in 2021. During the March and April 2020, as the pandemic took hold and the UK went into lockdown, medical oncology grew to a market share of 43% of all private activity.
The changes in market share were less dramatic at the beginning of 2021, with medical oncology growing 2% from 12% market share in December 2020 to 14% in February 2021.
Private activity by specialty as % admissions
As we start restrictions continue to ease, we may start to see the longer-term impact on NHS waiting lists and private care. We will continue to monitor this from the unique data we hold on private admissions across the UK.
We have provided a more detailed look at activity and share of the private market by medical specialty in the interactive graph below.
