The latest data on private activity in the UK shows a strong recovery at the end of 2020 following a year dominated by Covid-19, with admissions in December only 5% lower than December 2019.
This suggests a strong end to a turbulent year in private healthcare. Although activity in December was down 5% on the same month the previous year, this is the closest to 2019 levels we have seen since the beginning of the pandemic. This followed a relatively steady November, when England went into a national lockdown.
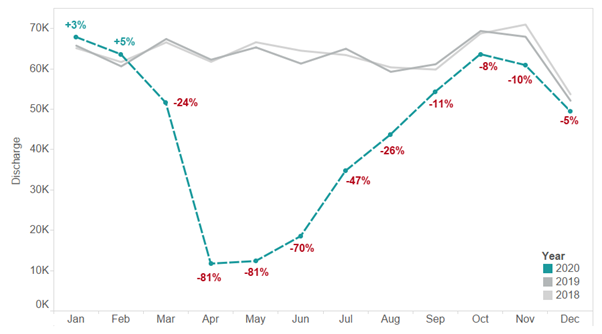
Estimated count of private episodes [1]
![2018, 2019 and 2020 (estimated) count of private admissions, with % change on the same month the previous year [1]](https://phproduksportalstorage.blob.core.windows.net/images/2020%20volume%20predictions.png)
While there was a slight drop in activity in November, there were still over 60,000 private admissions. This was 10% lower than the number of admissions in November 2019.
The year ended relatively strongly, with activity back to only 5% lower in December 2020 compared with December 2019. While there was a fall in overall activity in December, this follows the trends set in 2018 and 2019, with elective treatment generally stopping over Christmas and new year.
Private activity by specialty as % admissions
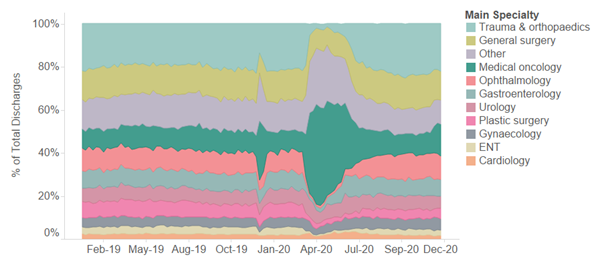
Looking at specialty split shows few significant changes in market share during the England lockdown in November. Trauma and orthopaedics (24%), general surgery (15%), and medical oncology (10%) maintaining the relative market share during this period. Although some specialties did experience a small drop in activity, this was negligible, particularly when compared to the dramatic reduction across all specialties earlier in the year, and patients were still able to access a broad range of healthcare services across this period.
In December we did see a shift with Medical Oncology growing from 10% in November, to 17% in December. This follows a familiar pattern where elective care tails off over Christmas while cancer care continues.
We have provided a more detailed look at market progression by specialty in the interactive graph below.
Interactive graph: Estimated admission and market share, 2020
Footnotes
1. Admissions are counted as the number of hospital stays that have been completed within our reporting period. Year on year change are calculated using only sites with confirmed volumes from 2019 and 2020 for each month. While more hospital sites are submitting data, only those where a two year comparison is possible have been included for year on year change. Estimates for 2020 activity assume these sites are representative of the entire market, with confidence varying depending on number of submitting sites.
Some statistics in this article were updated on 12/3/2021 due to a data error with the estimated market share in “interactive estimated admission and market share, 2020”.