In the latest of our quarterly updates, we use our unique, national dataset to provide a comprehensive view of the key trends in the independent healthcare sector up to, and including, the end of quarter one 2025.
The data covers private healthcare in-patient/day-case market activity and includes breakdowns by year for insured cases, ‘self-pay’, nation, Top 10 procedures, and demographics.
(Q1 = Jan – Mar; Q2 = Apr – Jun; Q3 = Jul – Sep; Q4 Oct – Dec)
Private healthcare sector market activity
At a glance
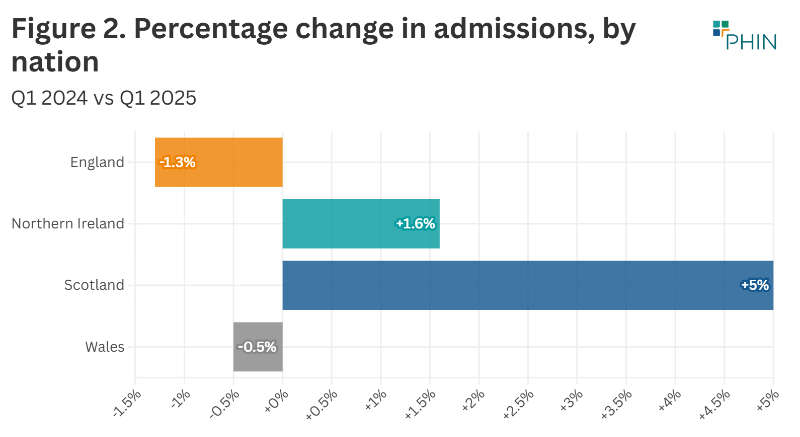
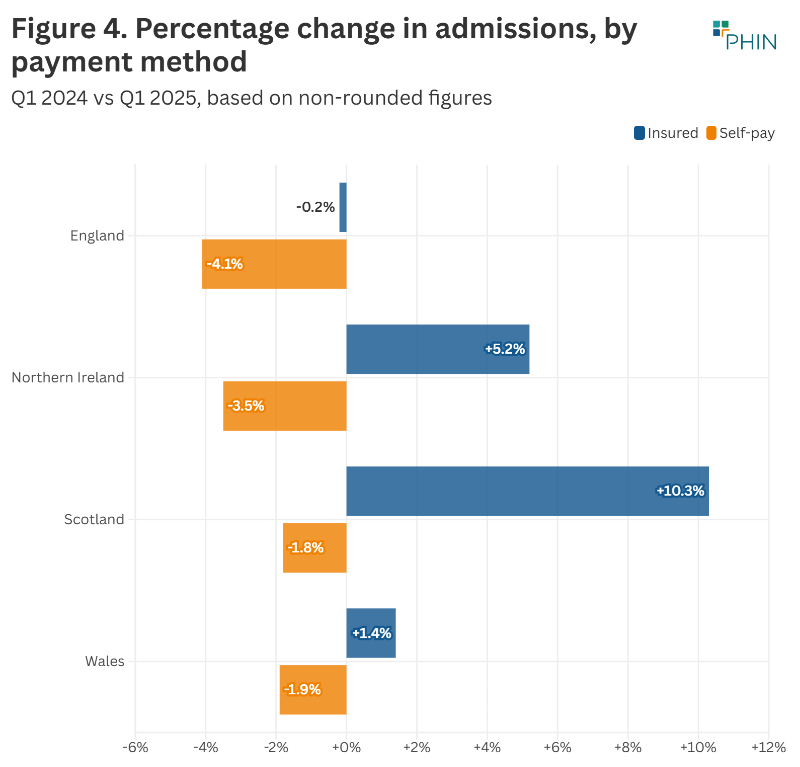
Changes from Q1 2024 to Q1 2025 in Wales:
- Reported private hospital/clinic admissions were at the same level.
- Private medical insurance admissions were up 1% to new record level.
- Self-pay admissions were down 2%.
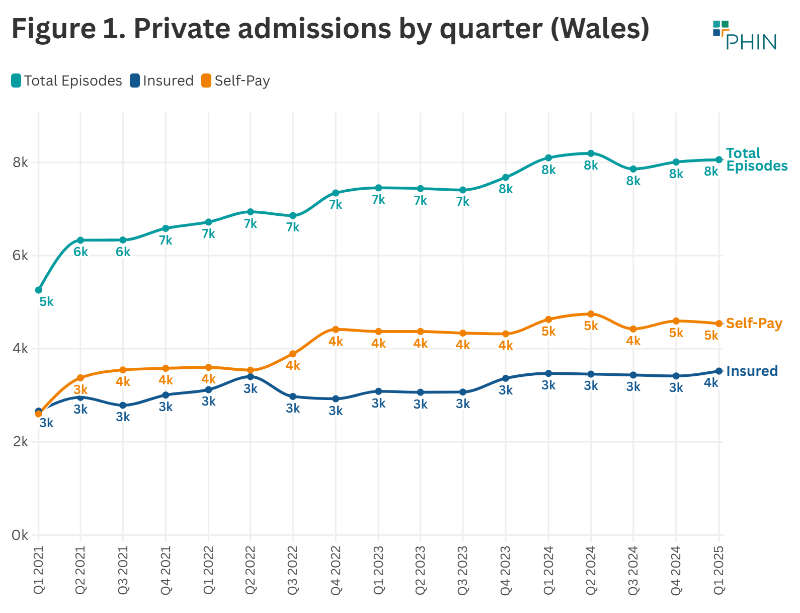
Q1 only slightly down from record independent healthcare in-patient admissions in 2024
The total number of admissions in Q1 2025 was 40 lower than in the same quarter in 2024 in Wales.
The peak of private admissions in Wales happened in Q2 2024, and Q1 2025 was only 2% below that level.
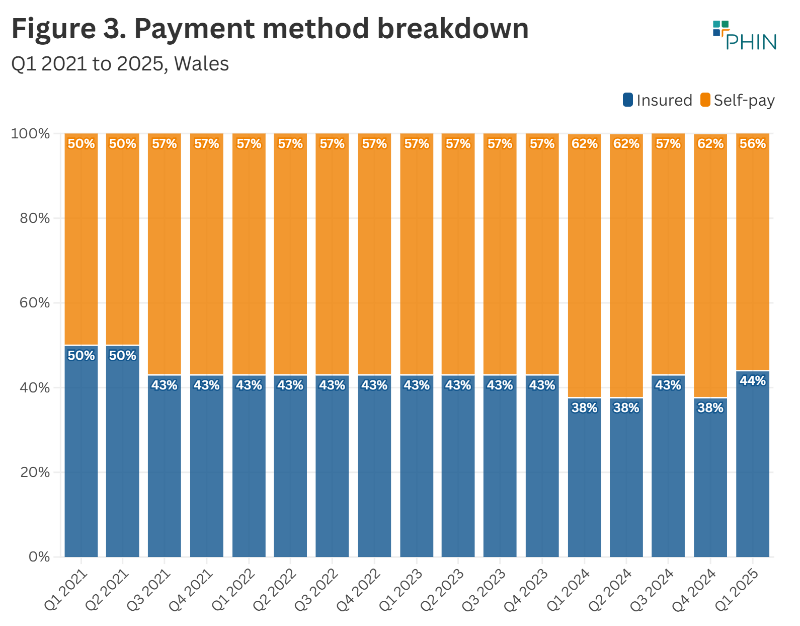
Private medical insurance funded admissions at record levels, as self-pay funded admissions decline
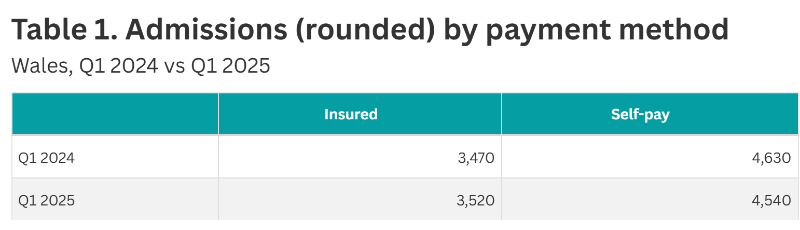
Reported insured admissions have been declining each quarter since the previous high in Q1 2024. However, in Q1 2025 they increased again and were at their highest level since before the Covid pandemic. There were 50 more insured admissions in Q1 2025 than in Q1 2024 (1% increase).
Self-pay has been the preferred method of payment for private admissions in Wales since the pandemic, but after a record high in Q2 2024 has begun to decline, and in Q1 2025 it was 2% down on the same quarter in 2024. There were 90 fewer self-pay admissions in Q1 2025 than in Q1 2024.
Self-pay funded admissions made up 56% of total admissions in Q1 2025, down from 62% in Q1 2024.
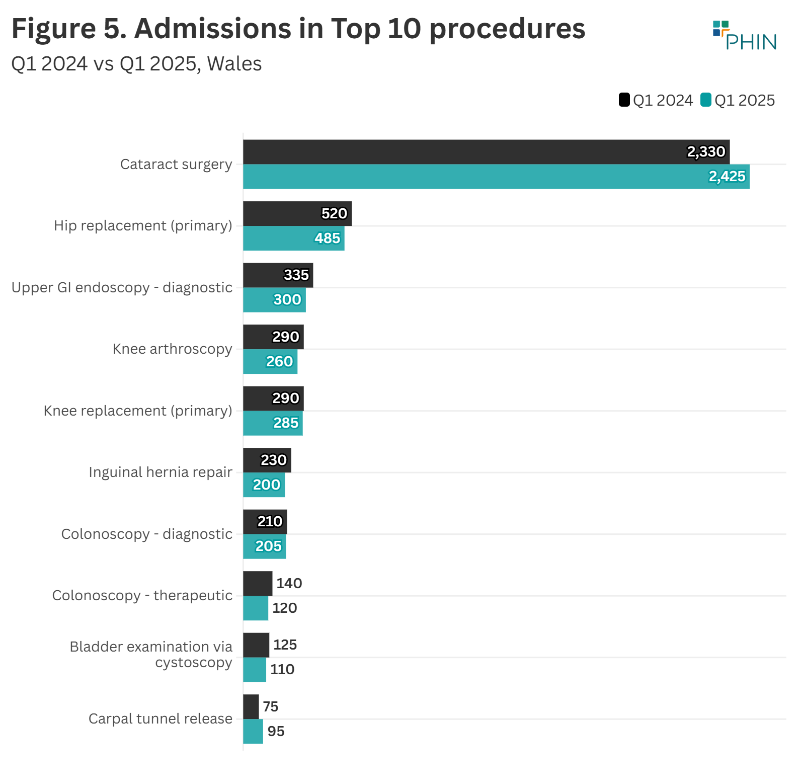
Top 10 procedures in Wales
There were fewer admissions for eight of the Top 10 most popular procedures in Q1 2025 compared to Q1 2024.
‘Hip replacement (primary)’ and ‘Upper GI endoscopy – diagnostic’ fell by the highest volume 35 each. ‘Inguinal hernia repair’ had the largest percentage fall (13%).
The highest rise in admissions (volume) was for ‘Cataract surgery’ which had an increase of 95 in the number of admissions. ‘Carpal tunnel release’ had the highest percentage change (26.7%), but from a much lower starting point.
Active consultants in private healthcare by quarter
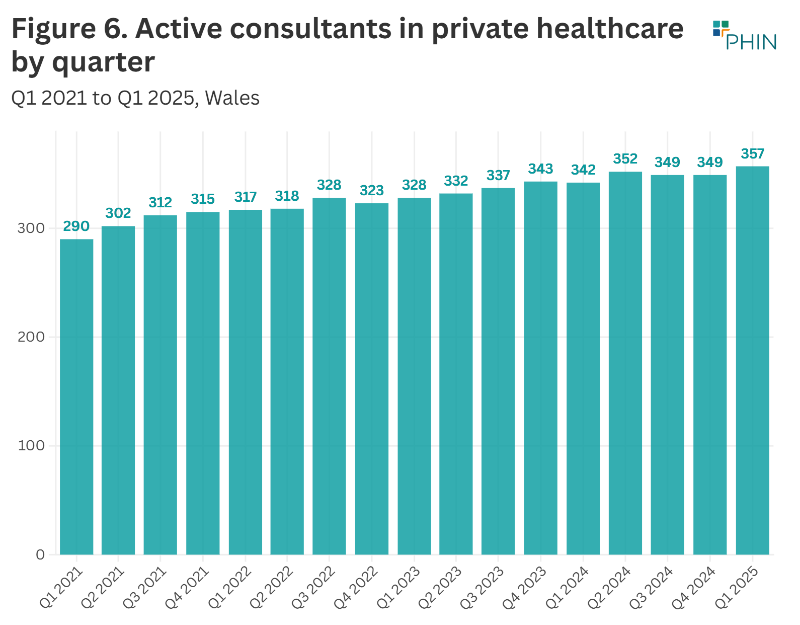
The number of consultants active in private healthcare regularly fluctuates as new consultants start working in the private sector, and existing ones go on sabbatical, stop working privately, or retire.
The number of active consultants in Wales in Q1 2025 was at the highest level ever recorded (357). The extra 15 consultants was a 4.4% increase on Q1 2024.
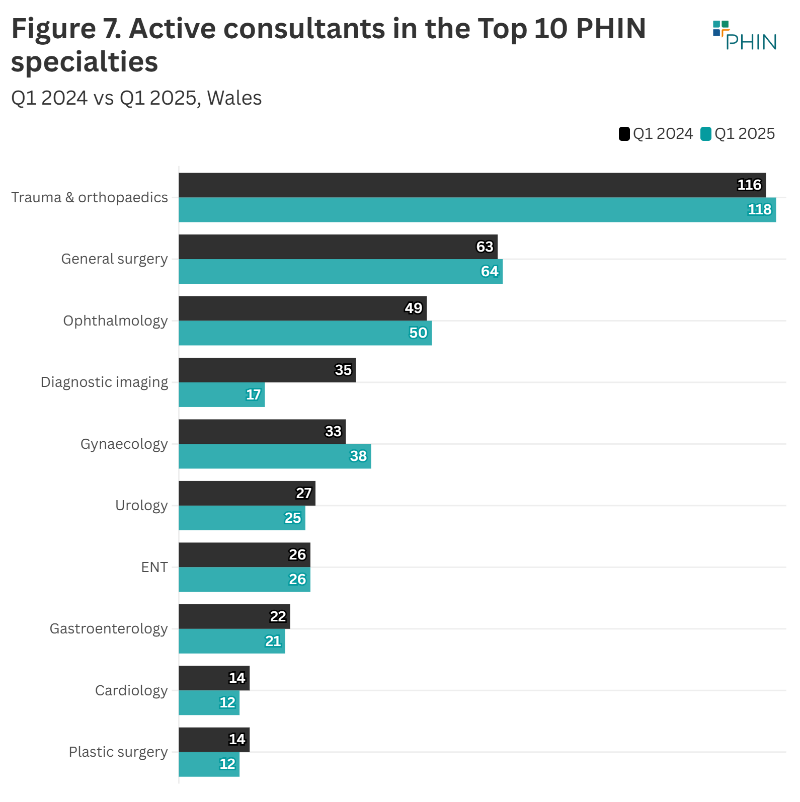
The largest volume increase in active consultants in the top 10 procedure groups in 2024 was in ‘General surgery’ with an extra 11 consultants (20%).
The number of consultants working in ‘Gynaecology’ had the largest percentage (15.2%) and volume increase with an extra five operating in Q1 2025 compared to the same quarter in 2024.
Patient demographics
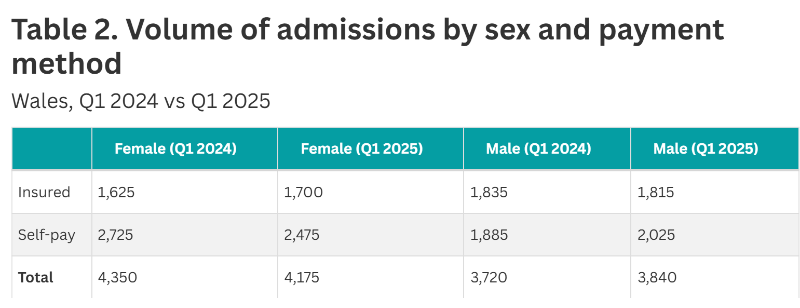
Payment method
There was a 4.6% increase in the number of insured admissions for female patients in Q1 2025 compared to Q1 2024, but for male patients the number of insured funded admissions fell by 1.1%.
Female self-pay funded admissions fell 9.2%, while male admissions were up 7.4%.
This represents a move towards more even distribution of the payment methods by sex, as currently more male patients use insurance to pay for their admissions and more female patients use self-pay.
Overall admissions for male patients were up (3.2%) and down for female patients (-4.1%).
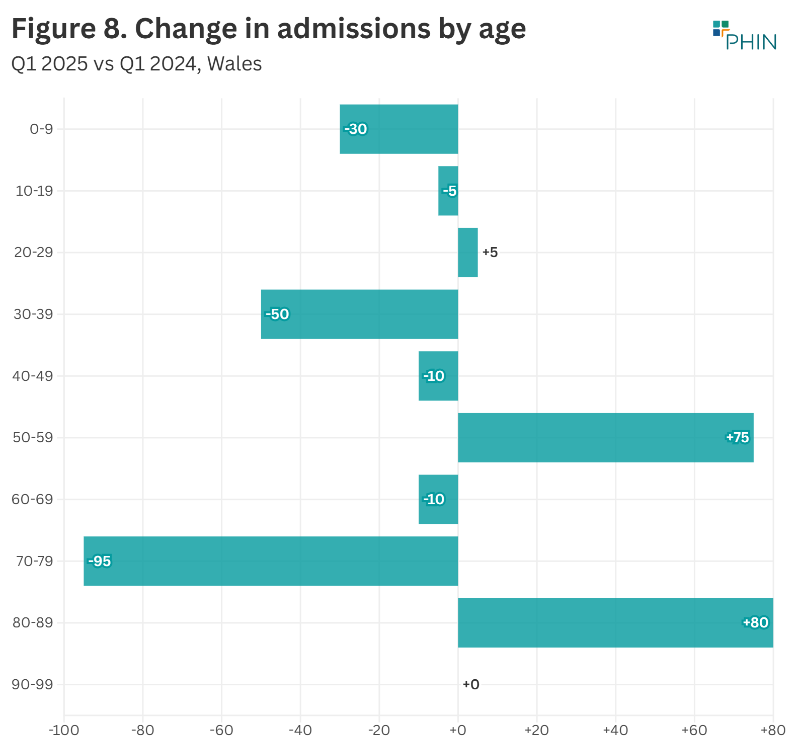
Volume of admissions by age
There was a decrease in admissions in all age groups in Q1 2025 compared to Q1 2024, except 20 to 29, and 50 to 59 and 80 to 89.
The largest volume (-95) was in the 70 to 79 year age range, and the largest percentage decrease (-43%) came for patients aged 0 to 9.
The largest volume (+75) and percentage increase (6%) was in the 50 to 59 age group.
Important notes
All data described above taken from PHIN’s unique, national private dataset describing discharge activity (day case and inpatient). This excludes activity outside of PHIN’s mandate from the Competition and Markets Authority, such as outpatient diagnostics, physiotherapy and mental health services.
There is a time lag between collecting, validating and processing the data we receive from hospitals before we can publish it. This can be up to six months after treatment has been completed, to ensure a fair process and accurate data.
Activity numbers have been rounded to the nearest five, with percentage based on the unrounded figures.