In the latest of our quarterly updates, we use our unique, national dataset to provide a comprehensive view of the key trends in the independent healthcare sector up to, and including, the end of quarter one 2025.
The data covers private healthcare in-patient/day-case market activity and includes breakdowns by year for insured cases, ‘self-pay’, nation/English region, Top 10 procedures, demographics and proportion of healthcare admissions compared to NHS England.
(Q1 = Jan – Mar; Q2 = Apr – Jun; Q3 = Jul – Sep; Q4 Oct – Dec)
Private healthcare sector market activity
At a glance
Changes from Q1 2024 to Q1 2025:
- Reported private hospital/clinic admissions were down 1% across the UK.
- Second highest number ever for reported admissions for any quarter (after Q1 2024).
- Private medical insurance admissions increased by less than 1%.
- Self-pay admissions were down 4%.
Private healthcare in-patient admissions down in first quarter 2025
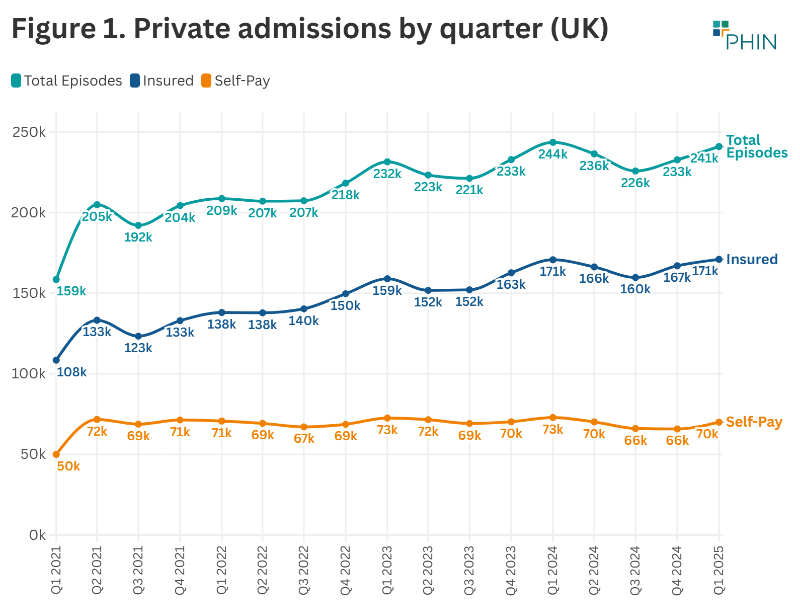
The total number of admissions in Q1 2025 was 240,730 (4% below Q1 2024). This is the first time there has been a decline in reported admissions for the first three months of a year since Q1 2021.
Despite the decline, Q1 2025 had the second highest level of reported admissions for any quarter that PHIN has data for (Q1 2024 is the highest).
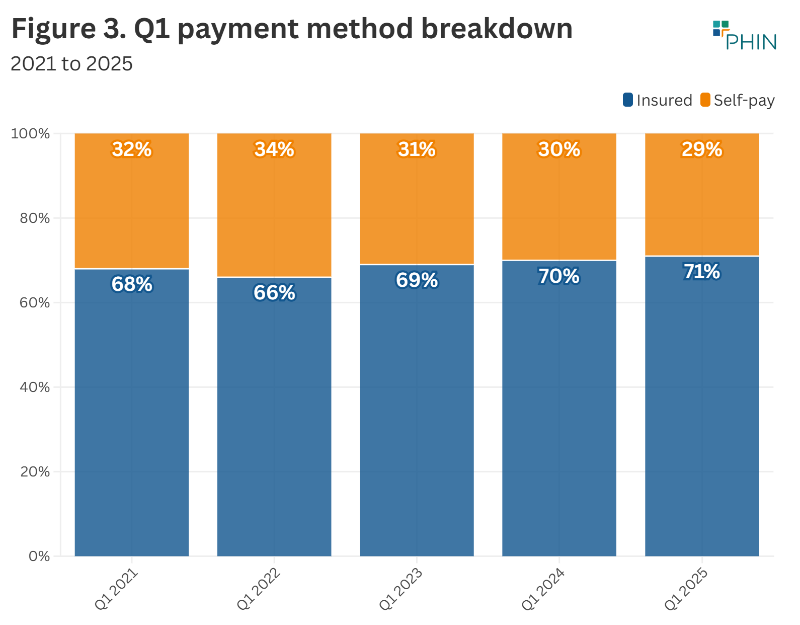
While levels of private insurance admissions remained constant in Q1 2025, there was a 4% fall in self-pay admissions from Q1 2024, which impacted the overall total.
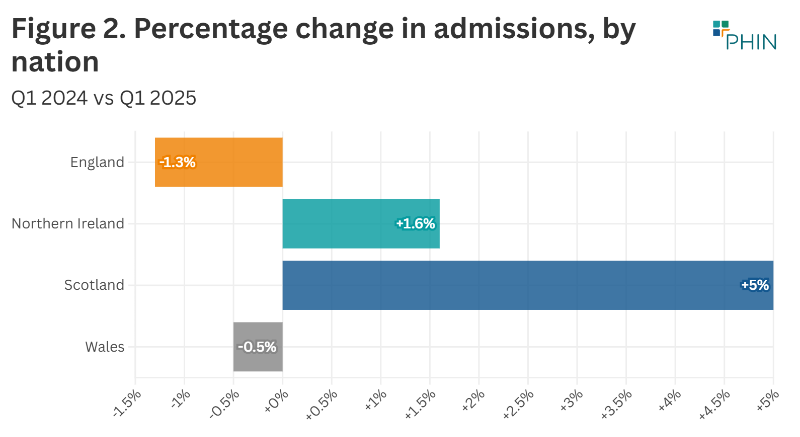
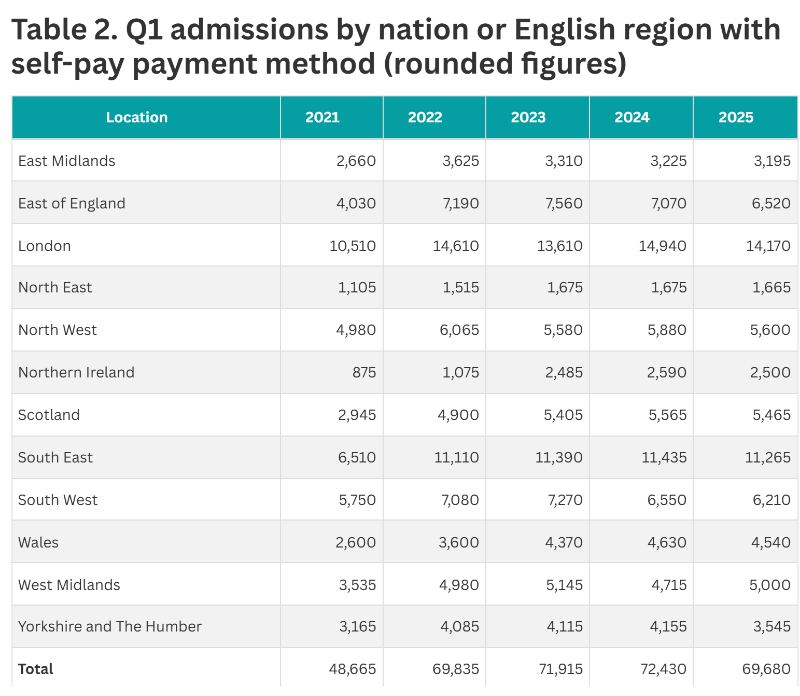
In Q1 2025, the number of admissions in Scotland (5%) and in Northern Ireland (1.6%) increased. There were declines in admissions in England (1.3%) and Wales (0.5%).
It is worth noting that in Q1 2025 NHS England admissions were at their highest levels (1,858,185) since Q3 2019, and at a similar level to Q1 2019 (1,859,075). This increase in NHS admissions could have affected the number of patients opting to use the private sector.
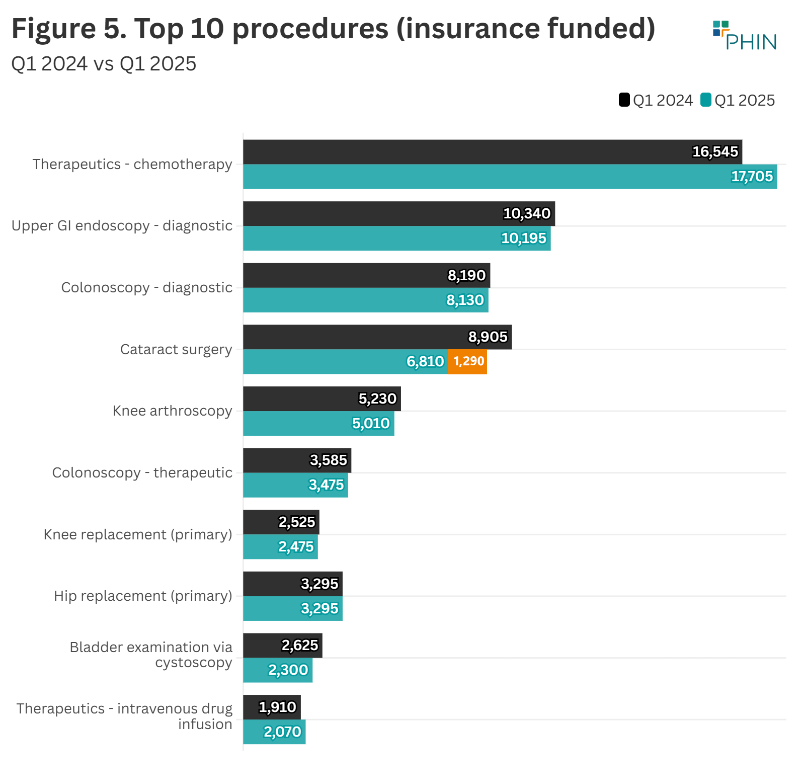
Private medical insurance funded admissions shows very small growth
Insured admissions
Reported admissions paid for with private medical insurance in Q1 2025 increased by less than half a percentage point compared to the same period in 2024. There were 730 more insured admissions than in Q1 2024 across the UK.
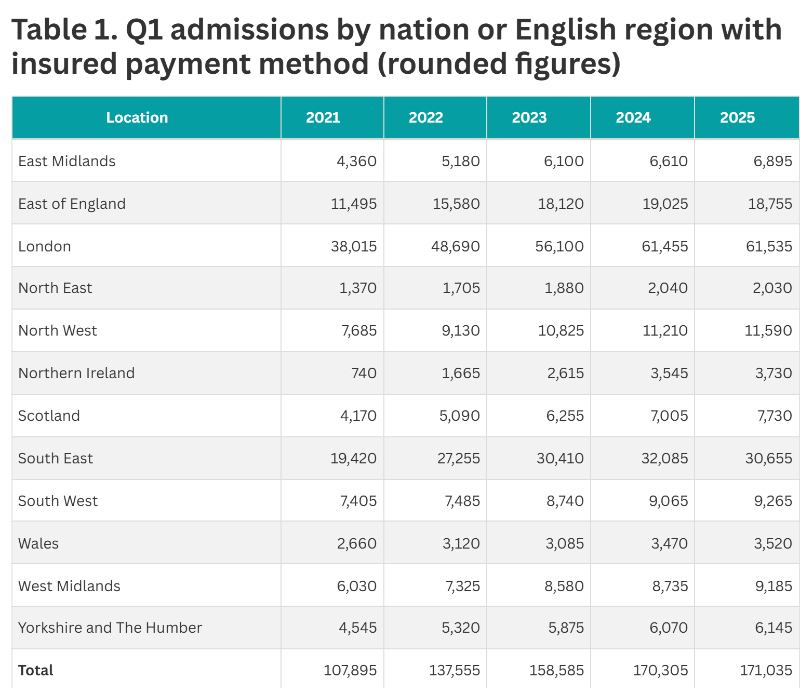
Compared to Q1 2024, the number of admissions using private medical insurance rose Scotland (10%), Wales (1.4%) and Northern Ireland (5.2%), but declined in England (-0.2%).
Insured admissions increased in all but three English regions – led by the West Midlands (5.2%) and East Midlands (4.3%) – but this growth was offset by the fall in admissions in the South East in particular (4.5%).
The other two regions with fewer insured admissions were the East of England and North East. The South East has the second highest number of admissions after London so a seemingly small percentage fall has a higher impact on the total than would be the case for other regions.
Self-pay admissions
Self-pay admissions in Q1 2025 were down by 2,750 (-4%) compared to Q1 2024, which had the highest ever number of self-pay admissions (72,440).
In Q1 2025, admissions financed by ‘self-pay’ fell in each of the devolved nations and every English region, except the West Midlands which increased by 6% compared to Q1 2024.
London and Yorkshire and the Humber had the biggest volume falls in England, with Yorkshire and the Humber also having the largest percentage fall (14.7%).
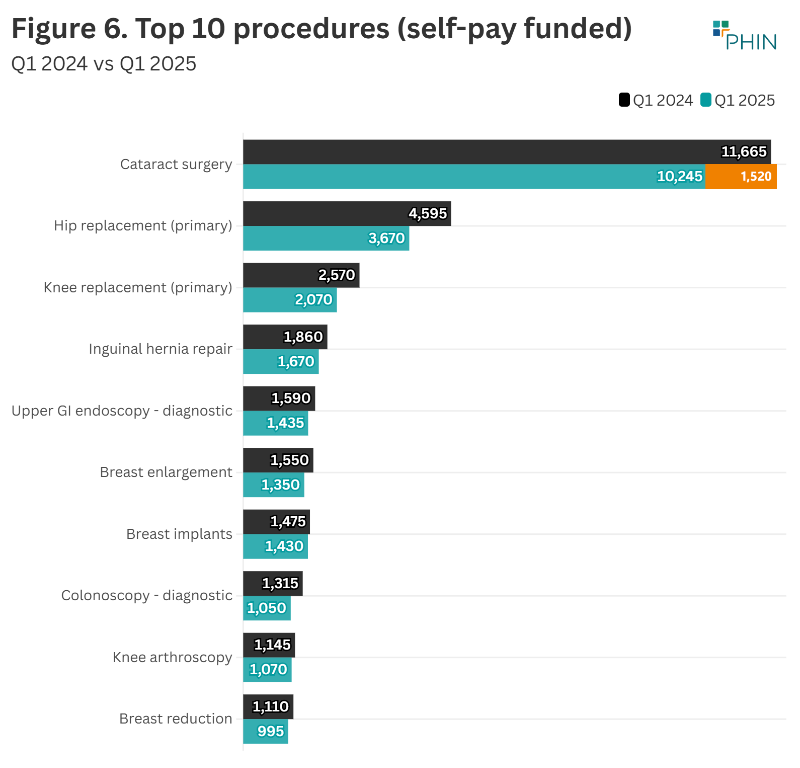
Top 10 procedures: UK
There was a reduction in admissions for all but one of the Top 10 by volume when comparing Q1 2025 to Q1 2024.
'Cataract Surgery' decreased by 705 admissions (3.4%). See note below.
PHIN now reports on the traditional form of ‘Hip replacement (primary)' and ‘Knee replacement (primary)’ and the robot-assisted version separately. ‘Hip replacement (primary) – robotic assisted’ increased by 5.3% and ‘Knee replacement (primary) – robotic assisted’ by 2.1%. However, the number of robotic-assisted procedures is lower than the reduction in the traditional methods, so is not the cause for the decline.
‘Therapeutics – chemotherapy’ was the only procedure in the Top 10 which had increased admissions, these were up by 1,040 (5.9%). Patients usually require multiple admissions for chemotherapy treatment and the number of admissions they have varies depending on their health.
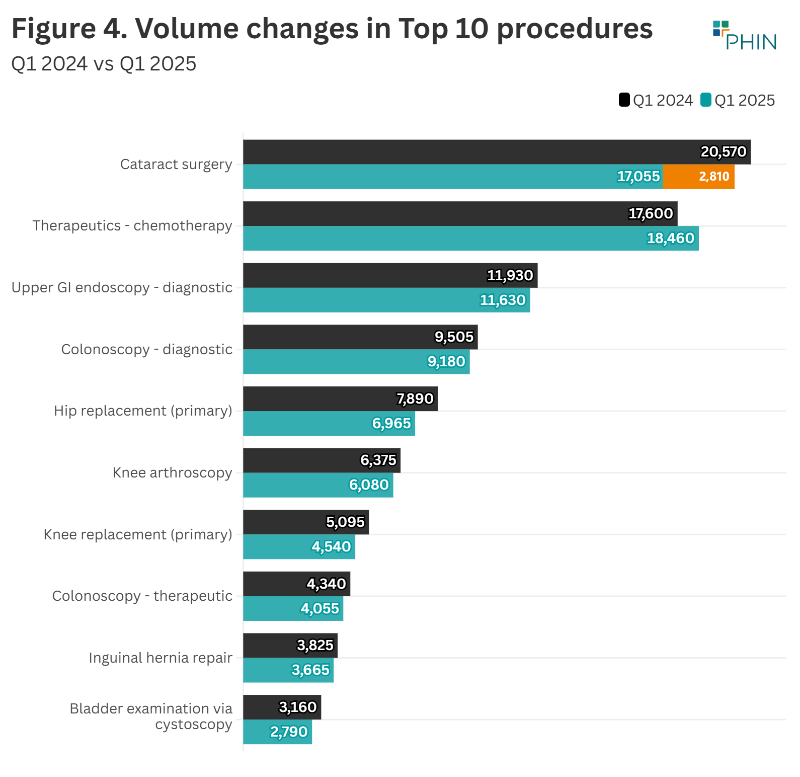
Note: Kingsbridge Hospital Group, Moorfields Eye Hospital, and Optegra, which perform cataract surgeries, did not include clinical coding (which shows the type of procedure) with their admissions data. PHIN has estimated their cataracts activity (2,810 admissions) using Q1 2024 data.
Market trends from Q1 2024 to Q1 2025
When looking beyond the Top 10 procedures, there was a 629% increase in ‘Varicose vein combined treatments’ and 483% increase in ‘Varicose vein sclerotherapy’. ‘Allergy testing’ also saw a large increase at 514%.
There was a reduction in ‘Weight loss surgery – gastrectomy’ (49%) and 'Tonsillectomy' (-13%).
Cosmetic procedures ‘Breast enlargement’ (-13%), ‘Breast implants’ (-3%) and ‘Breast reduction’ (-10%), 'Rhinoplasty' (-29%) all also declined.
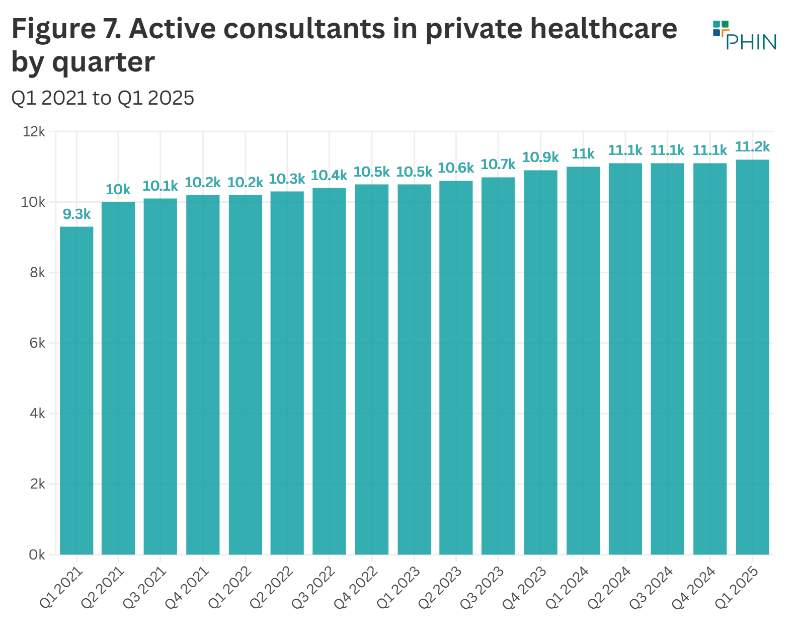
The number of consultants active in private healthcare regularly fluctuates as new consultants start working in the private sector, and existing ones go on sabbatical, stop working privately, or retire.
In Q1 2025 there were more active consultants than in any other quarter over the past five years.
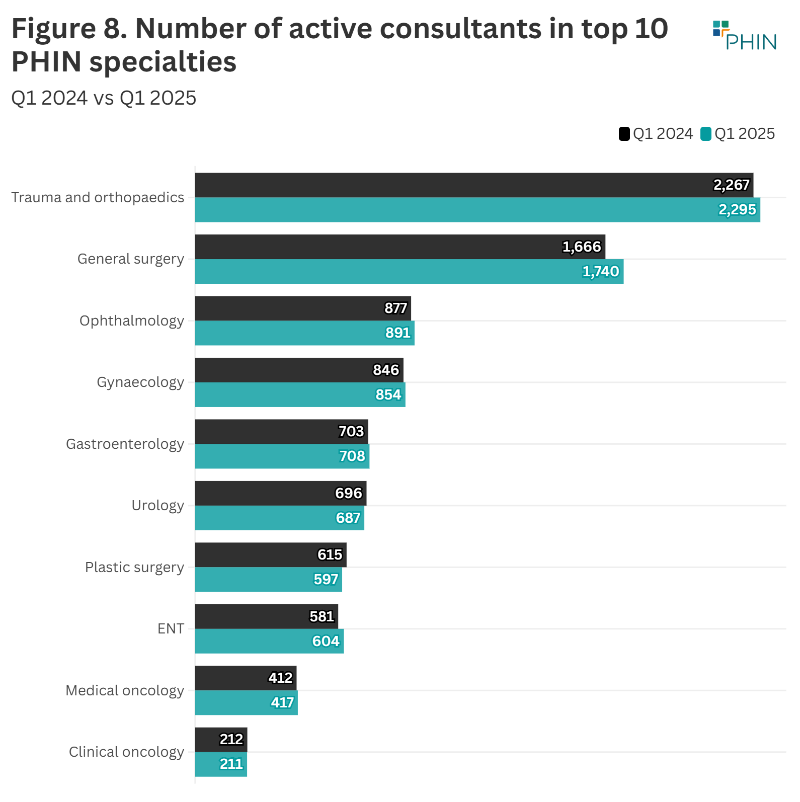
The largest volume and percentage increase in active consultants in the top 10 procedure groups in 2024 was in ‘General Surgery’ with an extra 74 consultants (4%).
‘Trauma & Orthopaedics’ had the next biggest volume increase with an extra 28 consultants (1.2%). ‘ENT’ had the next biggest percentage increase at 4% (an extra 23 consultants).
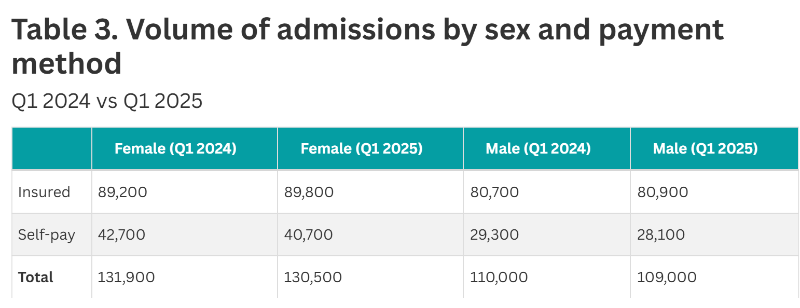
Patient demographics
There was a small decline in admissions for both sexes.
There was only a minimal change in the number of insured admissions for female patients (+0.7%) or male patients (+0.3%) compared to Q1 2024.
Female self-pay funded admissions fell 4.5% and male admissions were down 4%.
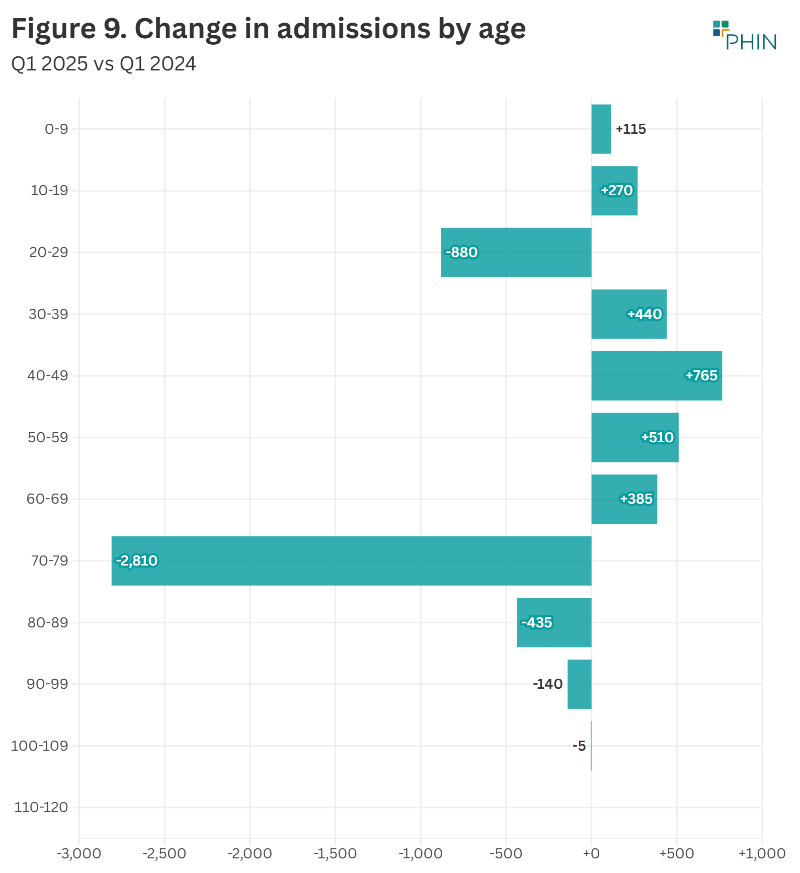
There was an increase in admissions in five age groups but a reduction in six, in Q1 2025 compared to the same quarter in 2024.
The largest volume increase was in the 40 to 49 age group (765 admissions) followed by the 50 to 59 age group (510 admissions). The largest percentage increase was in the 10-19 (6%) age group.
The largest volume decrease was in the 70 to 79 age group (-2,810) followed by the 20 to 29 age group (-880). The largest percentage decrease was in the 90-99 (8%) age group.
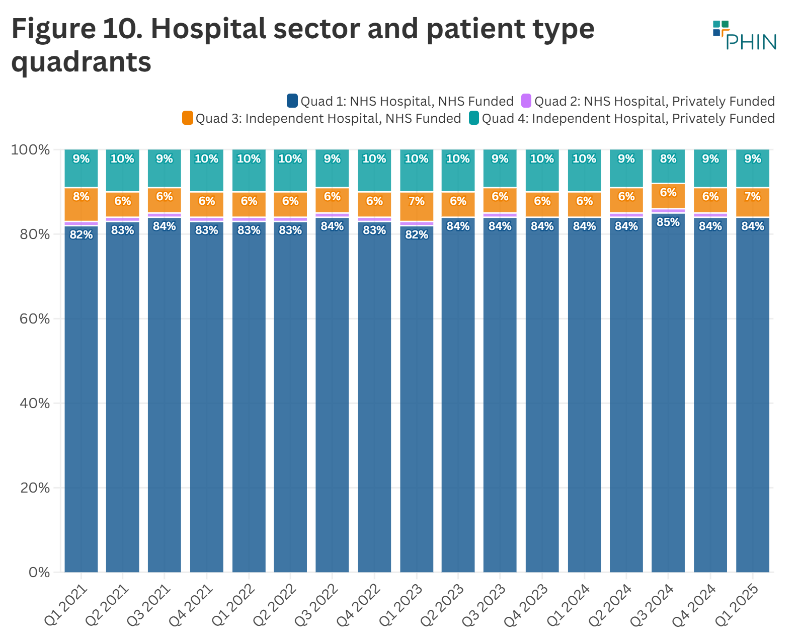
Private healthcare as proportion of English admissions
Despite the slight decline in private hospital/clinic admissions compared to Q1 2024, the proportion of the total day-case/in-patient admissions conducted in the UK increased slightly and was at the highest level since Q1 2023.
There were more NHS Hospital, NHS Funded admissions than in Q1 2024.
Important notes
All data described above is taken from PHIN’s unique, national private dataset describing discharge activity (day case and inpatient). This excludes activity outside of PHIN’s mandate from the Competition and Markets Authority, such as outpatient diagnostics, physiotherapy and mental health services. NHS data comes from Hospital Episode Statistics (HES).
There is a time lag between collecting, validating and processing the data we receive from hospitals before we can publish it. This can be up to six months after treatment has been completed, to ensure a fair process and accurate data.
Activity numbers have been rounded to the nearest five, with percentage based on the unrounded figures.