In the latest of our quarterly updates, we use our unique, national dataset to provide a comprehensive view of the key trends in the independent healthcare sector up to, and including, the end of quarter one 2025.
The data covers private healthcare in-patient/day-case market activity and includes breakdowns by year for insured cases, ‘self-pay’, nation, Top 10 procedures, and demographics.
(Q1 = Jan – Mar; Q2 = Apr – Jun; Q3 = Jul – Sep; Q4 Oct – Dec)
Private healthcare sector market activity
At a glance
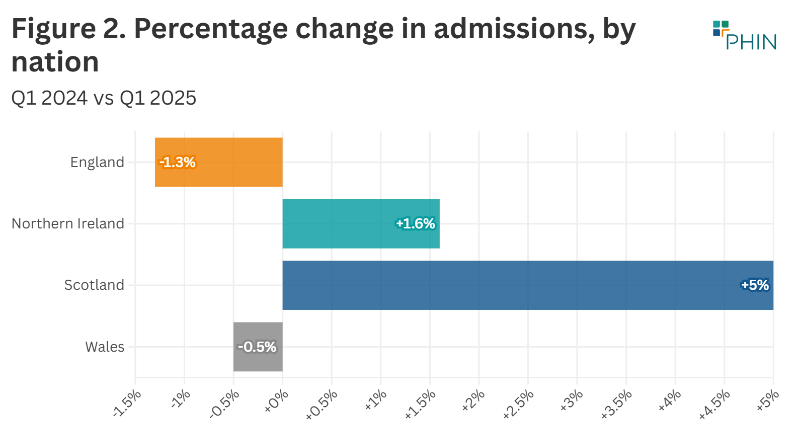
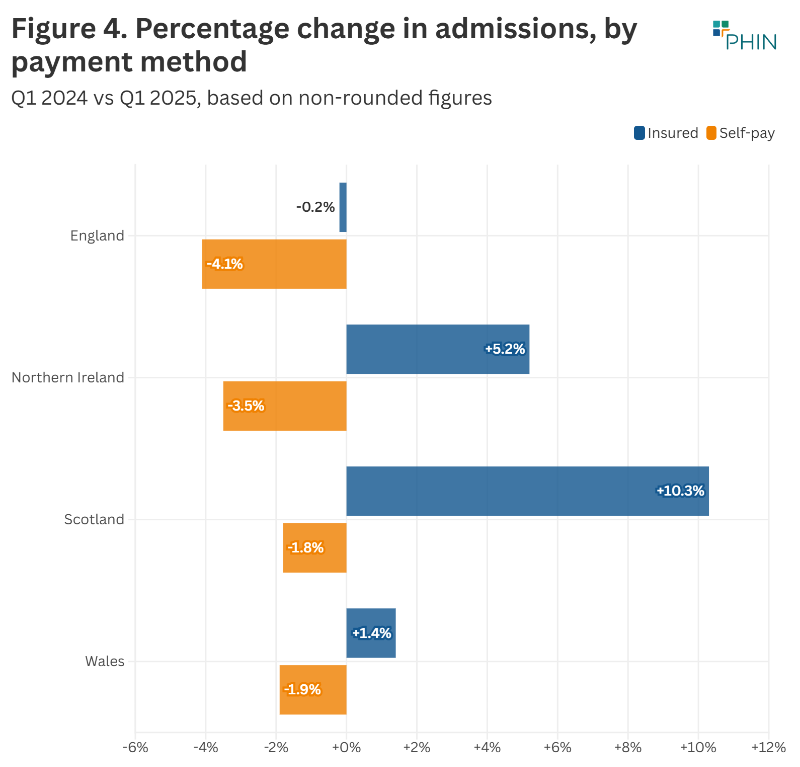
Changes from Q1 2024 to Q1 2025 in Scotland:
- Reported private hospital/clinic admissions were up 5%.
- Private medical insurance admissions were up 10% to new record level.
- Self-pay admissions were -2%.
Record independent healthcare in-patient admissions in Q1 2025
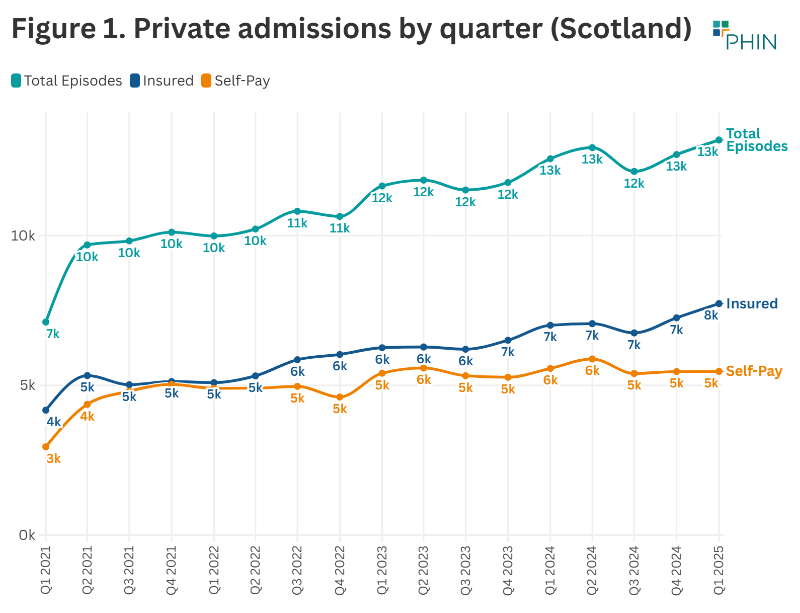
The total number of admissions in Q1 2025 was 13,195 (5% above Q1 2024) meaning the private sector in Scotland had more admissions than in any previous quarter on record.
Having been just below 13,000 for three of the previous four quarters, reported admissions went over that total for the first time.
There were 625 more reported admissions in Q1 2025 than in Q1 2024.
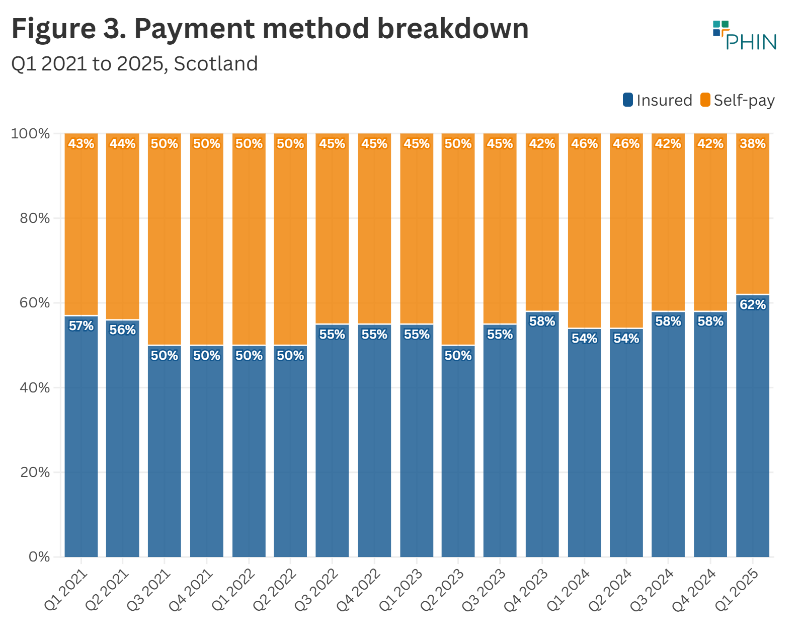
Private medical insurance funded admissions at record levels, as self-pay funded admissions decline
Having been at about 7,000 for the previous five quarters, reported insured admissions went above 8,000 in Q1 2025, meaning that there were more insurance funded admissions than ever before in Scotland. There were 725 more insured admissions in Q1 2025 than in Q1 2024 (10% increase).
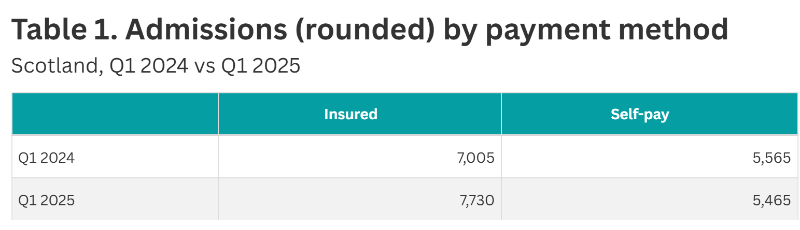
There were 5,465 self-pay funded admissions in Q1 2025. This was 415 fewer self-pay admissions in Q1 2025 than in Q1 2024 (2% decrease).
Private medical insurance funded admissions made up 62% of total admissions, the highest proportion since the Covid pandemic.
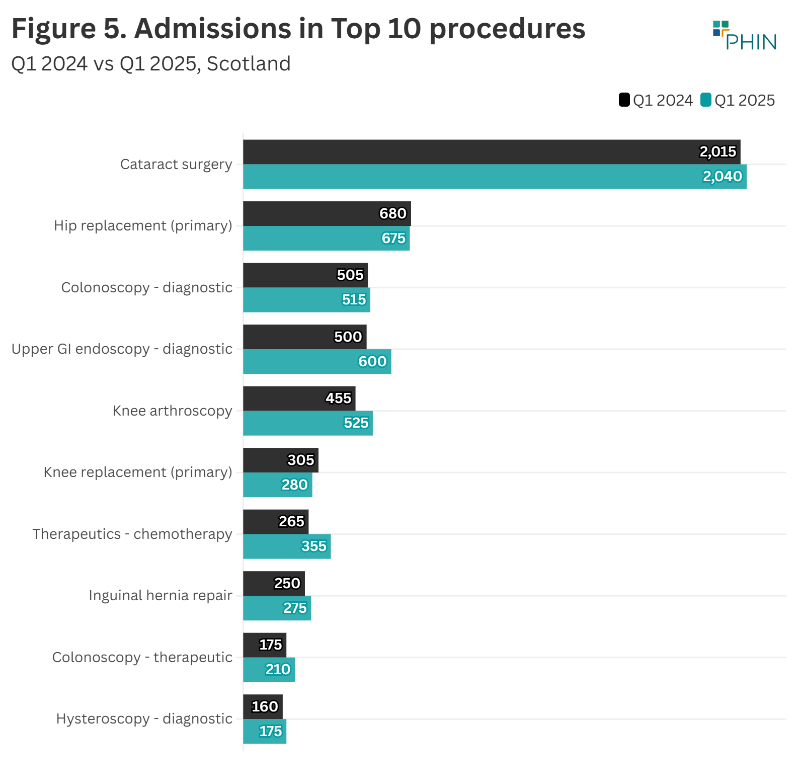
Top 10 procedures in Scotland
The number of admissions increased in eight of the Top 10 most popular procedures, but fell in the other two. The highest rise in admissions (percentage and volume) was for ‘Upper GI endoscopy - diagnostic’ at over 20%, an increase of 100 in the number of admissions.
‘Knee replacement (primary)' fell by the highest percentage (8%) with 25 fewer of these procedures taking place in Q1 2025 compared to Q1 2024.
Active consultants in private healthcare by quarter
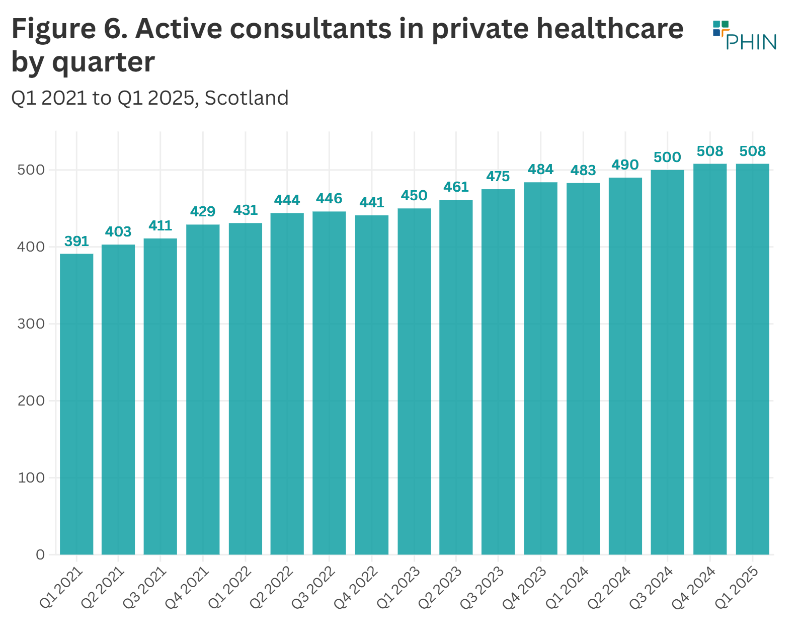
The number of consultants active in private healthcare regularly fluctuates as new consultants start working in the private sector, and existing ones go on sabbatical, stop working privately, or retire.
The number of active consultants in Scotland in Q1 2025 was at the joint highest level ever recorded (508). This is 12% higher than Q1 2024.
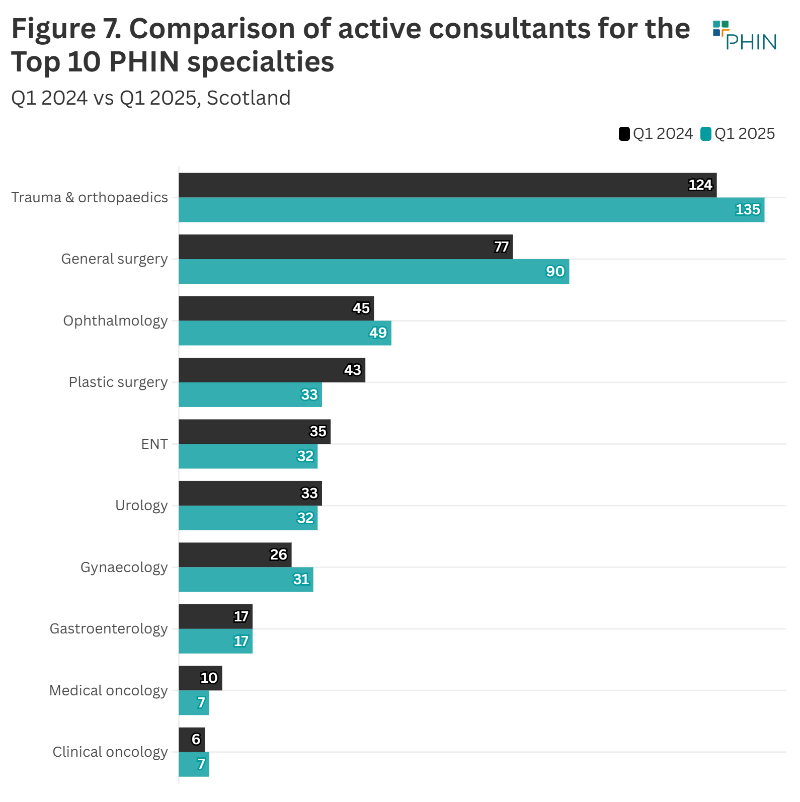
The largest volume increase in active consultants in the top 10 procedure groups in 2024 was in ‘General surgery’ with an extra 13 consultants (16.9%).
The number of consultants working in ‘Medical Oncology’ had the largest percentage decrease (24%) with three less working in Q1 2025 compared to the same quarter in 2024.
Patient demographics
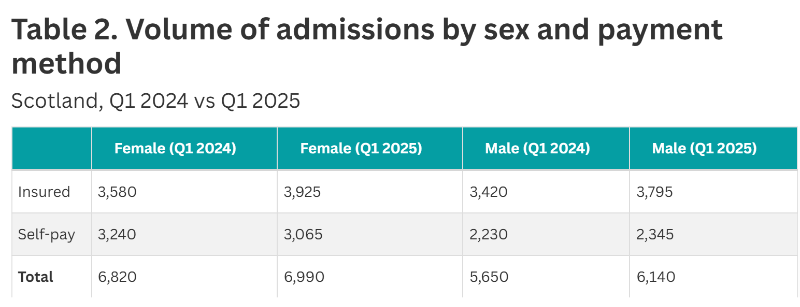
Payment method
There was an increased number of insured admissions for both sexes in Q1 2025 compared to Q1 2024. Insured funded admissions for female patients increased by 9.6% and male patients by 11%.
Female self-pay funded admissions fell 5.4%, while male admissions were up 1.1%.
Overall admissions were up (2.6%) for female patients and male patients (7.1%).
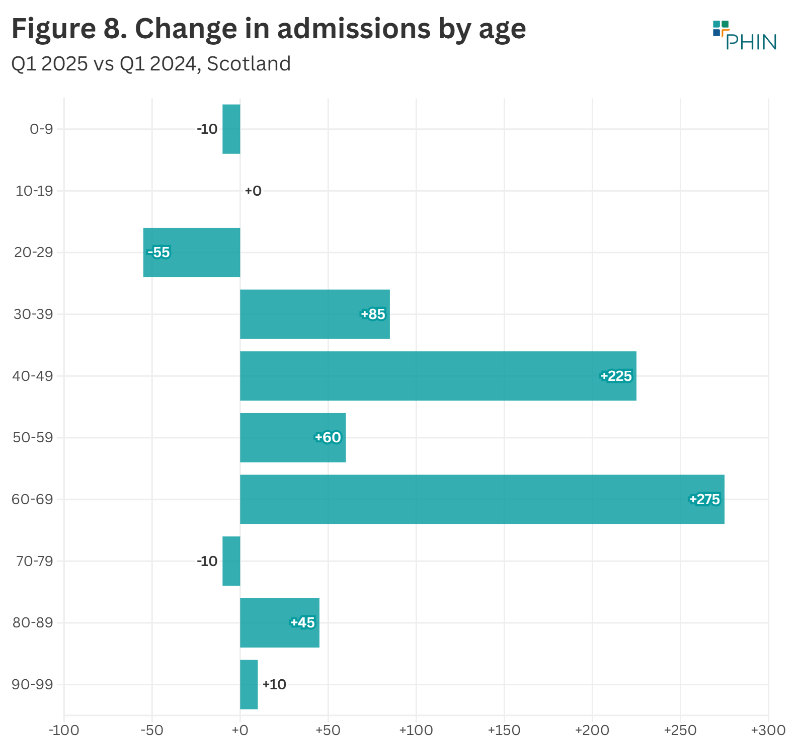
Volume of admissions by age
There was an increase in admissions in all age groups in Q1 2025 compared to Q1 2024, except 0 to 9, 20 to 29, and 70 to 79.
The largest volume increase was in the 60 to 69 age group (+275) followed by the 40 to 49 age group (+225). These two groups both had the highest percentage increases as well (12%).
The largest volume (-55) and percentage decrease (-7%) came for patients aged 20 to 29.
Important notes
All data described above taken from PHIN’s unique, national private dataset describing discharge activity (day case and inpatient). This excludes activity outside of PHIN’s mandate from the Competition and Markets Authority, such as outpatient diagnostics, physiotherapy and mental health services.
There is a time lag between collecting, validating and processing the data we receive from hospitals before we can publish it. This can be up to six months after treatment has been completed, to ensure a fair process and accurate data.
Activity numbers have been rounded to the nearest five, with percentage based on the unrounded figures.