In the latest of our quarterly updates, we use our unique, national dataset to look at the key trends in the independent healthcare sector up to, and including, Q1 2023. The data covers private healthcare in-patient/day-case market activity, insured cases, ‘self-pay’, along with national/regional and procedural breakdowns and demographic information. (Q1 = Jan – Mar; Q2 = Apr – Jun; Q3 = Jul – Sep; Q4 Oct – Dec)
Private healthcare sector market activity
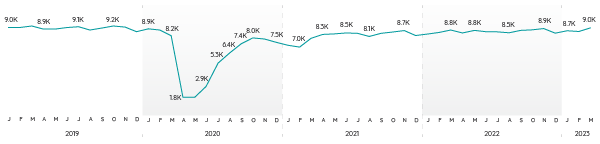
In-patient/day-care admissions comparison Q1 2019 – Q1 2023
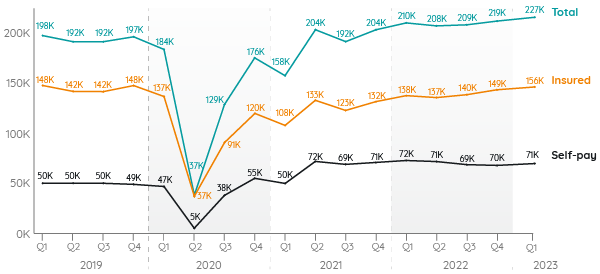
Growth in independent healthcare in-patient admissions continues into 2023
In January to March 2023 (Q1), there were 227,000 admissions the highest total of private admissions since PHIN began collecting data. This was 17,000 more private admissions than in the same quarter in 2022.
The number of admissions paid for with private medical insurance also reached record levels, with 156,000 paid for in this way. There were 18,000 more insured admissions than in the same period in 2022.
Self-pay admissions also increased in Q1 2023 after having fallen slightly in the middle of 2022. They returned to similar levels to the same period in 2022, which had the joint highest ever levels (72,000 in Q2 2021 and Q1 2022).
Private medical insurance in-patient/day-case admissions hit new heights
The high figures for procedures paid for with private medical insurance in Q1 2023, continues the upward trend over the past year and reflects the increased take up reported by insurers.
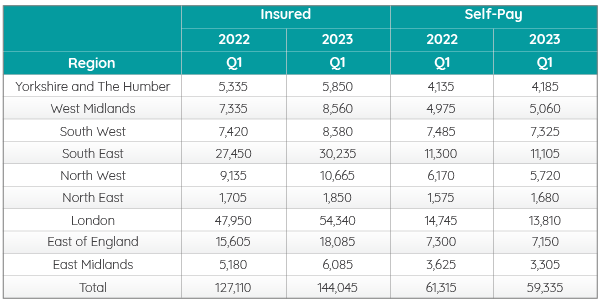
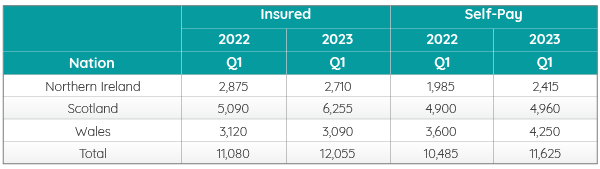
The number of insured admissions increased in every English region (+13% across England) and in Scotland (+23%), but fell in Northern Ireland (-6%) and Wales (-1%).
Although the total number of self-pay admissions increased again slightly, there was a mixed picture across the UK. There was an increase in each of the devolved nations and three English regions (Yorkshire and The Humber, West Midlands, and North East), but a decrease in the remaining six English regions (South West, South East, North West, London, East of England and East Midlands).
The biggest increase in self-pay admissions came in Wales (+18%) and Northern Ireland (22%).
Admissions by English Region
Admissions by Devolved Nation
Change from Q1 2022 to Q1 2023
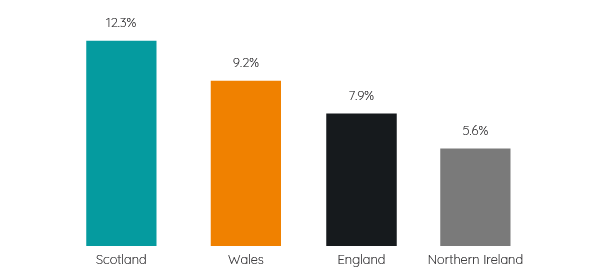
The number of admissions increased most between the equivalent periods in 2022 and 2023 in Scotland for the combination of insured and self-pay.
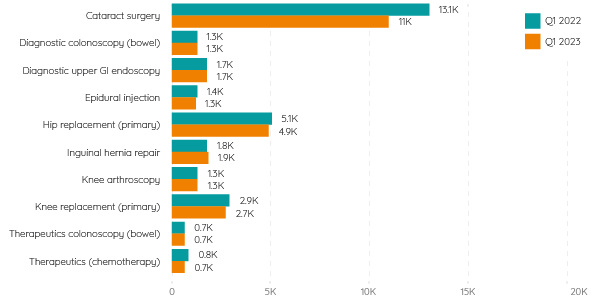
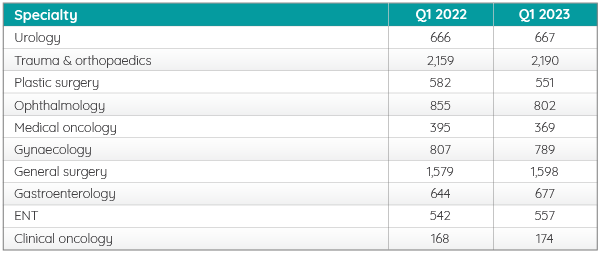
Top 10 procedures by funding method
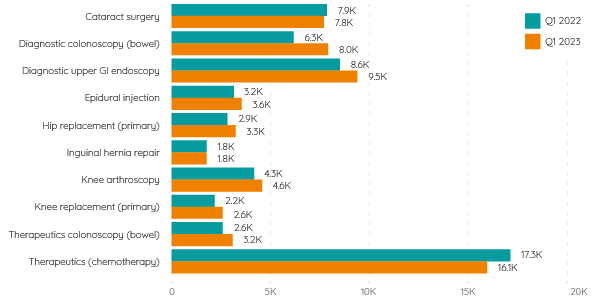
The number of insured admissions increased for 8 out of 10 of the most common procedures when comparing Q1 2022 to Q1 2023. Of the two that decreased, cataract admissions was only marginally lower than in Q1 2022.
The largest increase was in ‘Diagnostic Colonoscopy – bowel’ and the biggest decrease was in ‘Therapeutics – chemotherapy’.
Self-pay admissions for the top 10 procedures were mostly consistent when comparing Q1 2022 to Q1 2023. The largest change was in cataracts (-2.1K), although it remained the most common self-funded procedure by a clear margin.
Active consultants in private healthcare
The number of consultants active in private healthcare regularly fluctuates, but reached its highest level for over three years in March 2023 at 9k.
Quarterly comparison of active consultants for the top 10 PHIN procedure groups
Patient demographics
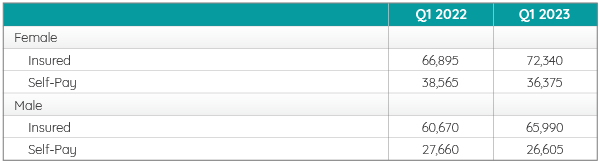
Volume of admissions by sex and payment method
There continued to be more female admissions than male. Both had an increased number of insured admissions and reduction in self-paid admissions compared to the same quarter in 2022.
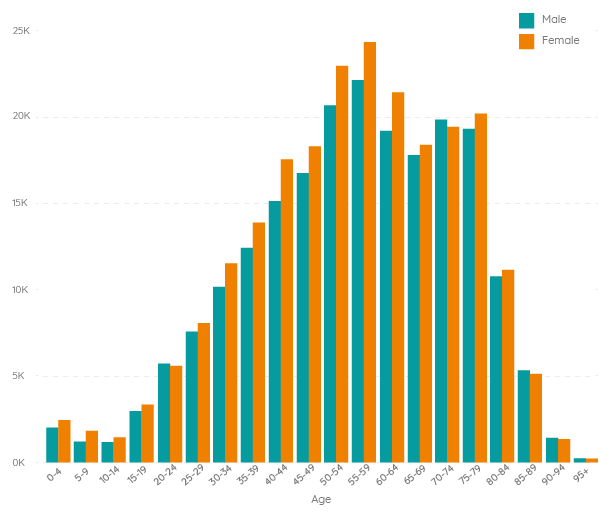
There was an increase in private admissions across all age groups, except 20-24 years, 70-74 years and 80-84 years.
Important notes
All data described above taken from PHIN’s unique, national private dataset describing discharge activity (day case and inpatient). This excludes activity outside of PHIN’s mandate from the Competition and Markets Authority, such as outpatient diagnostics and mental health.
There is a time lag between collecting, validating and processing the data we receive from hospitals before we can publish it. This can be up to 6 months after treatment has been completed, to ensure a fair process and accurate data.
Activity numbers have been rounded to the nearest 5, with percentage based on the unrounded figures.