In the latest of our quarterly updates, we use our unique, national dataset to look at the key trends in the independent healthcare sector up to, and including, Q4 2022, comparing annual data. The data covers private healthcare in-patient/day-case market activity, insured cases, ‘self-pay’, along with national/regional and procedural breakdowns and demographic information. (Q1 = Jan – Mar; Q2 = Apr – Jun; Q3 = Jul – Sep; Q4 Oct – Dec)
Private healthcare sector market activity
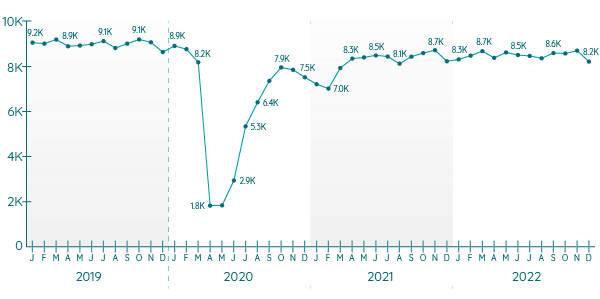
In-patient/day-care admissions comparison Q1 2019 – Q4 2022
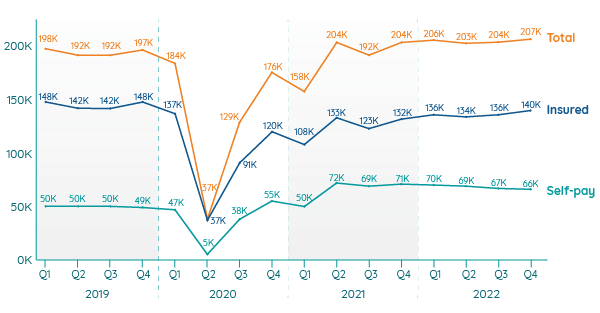
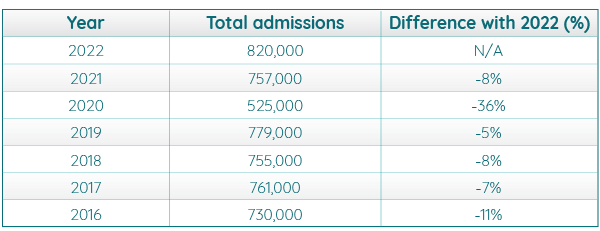
Independent healthcare in-patient admissions hit highs in 2022
There were more private in-patient/day-case admissions (820,000) in 2022 than in any previous year since PHIN began collecting data. This compares to 757,000 in 2021 and 779,000 in 2019.
At 207,000 the total for Q4 2022 was the highest for any individual quarter so far recorded by PHIN.
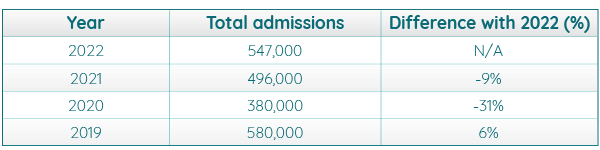
Private medical insurance in-patient/day-case admissions on the rise
In Q4 2022, procedures paid for with private medical insurance reached their highest rate since the pandemic. This continues the upward trend over the past few quarters and is the first time insured admissions have reached over 140,000 since Q4 2019.
In 2022 insured admissions were higher than the two previous years and only 6% below 2019.
Insured in-patient/day-case admissions in the regions by year (rounded)
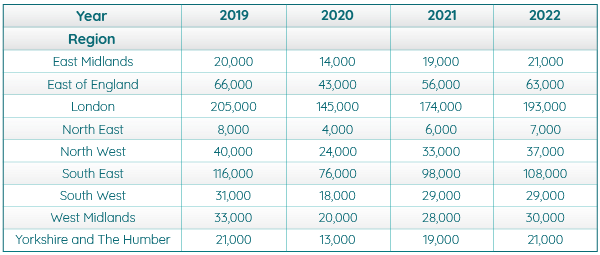
In 2022, insured admissions were above 2021 levels in every English region except the South West where they were the same.
Every region except the East Midlands (which had a 5% increase in 2022 on 2019) and Yorkshire and The Humber (which stayed the same) remains below pre-pandemic levels. The North East has had the biggest fall (-13%), but from the lowest base.
London and the South East remain the regions with the highest levels of insured admissions.
Insured in-patient/day-case admissions in the devolved nation by year (rounded)*

Insured admissions have remained constant in Northern Ireland (excluding 2020) and were at their joint highest in 2022. In Scotland (-8%) they remain below pre-pandemic levels, but are increasing year-on-year in line with the pattern for the UK as a whole and Wales where there was a 9% increase.
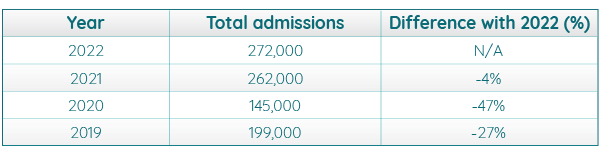
Yearly high for self-pay in-patient admissions, but growth stalls
There were more ‘Self-pay’ (people paying for their own treatment rather than using insurance) admissions (272,000) in 2022 than in any other year PHIN has data for. This was despite a quarter-on-quarter decline throughout the year.
Self-pay in-patient admissions in the regions by year (rounded)
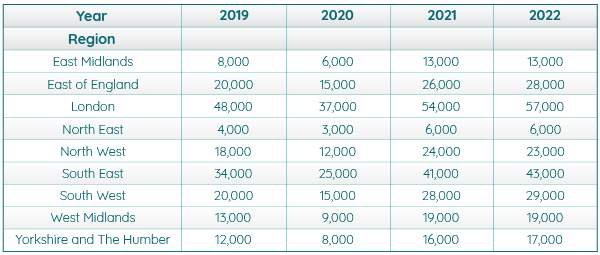
Self-pay admissions were at their highest (or joint highest) levels over the past four years in eight out of nine English regions. The North West was the only region where this was not the case and that is because of a slight reduction on 2021, which was its highest year of the four.
London and the South East are again the regions with the most procedures although the difference is not as significant as it is for insured admissions.
Self-pay in-patient admissions in the devolved nation by year (rounded)*

Each of the devolved nations had more (or the same) self-pay admissions than in any of the preceding three years, with significant growth in Scotland (73%) and Wales (114%) since before the pandemic.
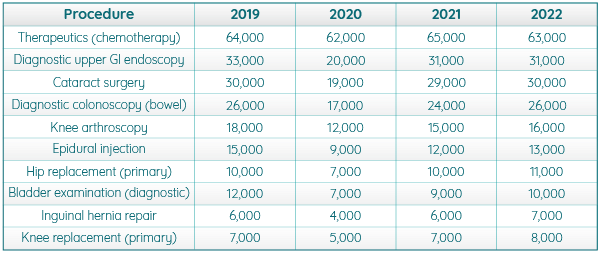
Top 10 independent healthcare in-patient procedures 2019 – 2022*
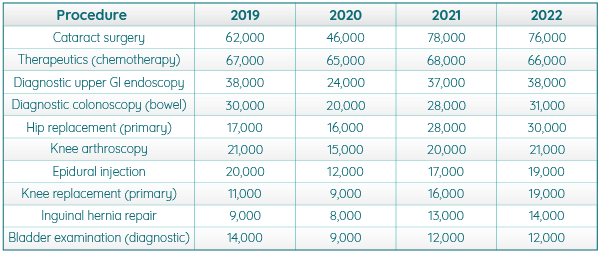
Six of the top 10 procedures are being conducted more often than, or as often as, in 2019. Of the remaining four, Epidural injection (-5%), Diagnostic upper GI endoscopy (3%) and Therapeutics (chemotherapy) (-1%) are only slightly lower. Bladder examination (diagnostic) is down the most at -14%.
Hip replacement (76%), knee replacement (64%) and Inguinal hernia repair (56%) have had the biggest increases from 2019 to 2022.
There were more episodes of cataract surgery in 2021 than 2022, but it remains the most commonly conducted procedure, by a significant margin.
Top 10 independent healthcare insured in-patient procedures 2019 – 2022*
For insured cases, only hip replacement (primary), inguinal hernia repair and knee replacement (primary) procedures are being conducted more often than in 2019. Cataract surgery and Diagnostic colonoscopy (bowel) procedures remain at the same level. The remaining five top 10 procedures are being performed less often than in 2019 (though eight of them were performed more frequently than in 2021).
Top 10 independent healthcare self-pay in-patient procedures 2019 – 2022*
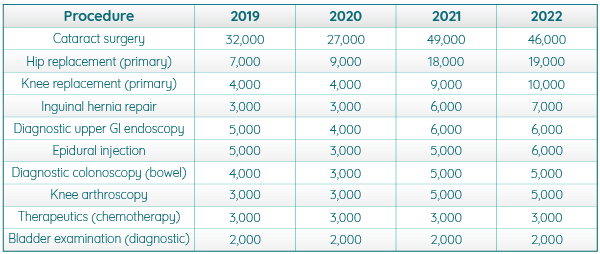
While cataract surgery remains the most popular self-pay procedure by a significant margin, hip replacements (171%) and knee replacements (150%) and Inguinal hernia repair (131%) increased the most between 2019 and 2022.
Apart from cataract surgery, each of the of the top 10 procedures are being conducted at the same of higher levels than in 2021 and none are being conducted less often than they were before the pandemic.
Active consultants in private healthcare
Active consultants for the Top 10 PHIN Procedure Groups

Patient demographics
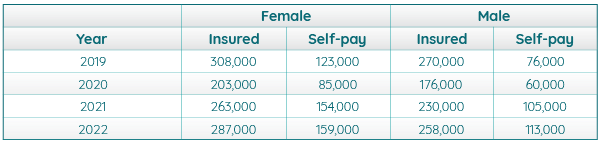
Women continued to make up the larger percentage of private patients for both the self-pay and insured admissions in 2022.
Volume of admissions by gender and payment type
Important notes
All data described above taken from PHIN’s unique, national private dataset describing discharge activity (day case and inpatient). This excludes activity outside of PHIN’s mandate from the Competition and Markets Authority , such as outpatient diagnostics and mental health.
There is a time lag between collecting, validating and processing the data we receive from hospitals before we can publish it. This can be up to 6 months after treatment has been completed, to ensure a fair process and accurate data.
Activity numbers have been rounded to the nearest 5, with percentage based on the unrounded figures.