In the latest of our quarterly updates, we use our unique national dataset to provide a comprehensive view of the key trends in Northern Ireland’s independent healthcare sector, up to and including the end of Q3 2025.
The data covers private healthcare in-patient/day-case market activity and includes breakdowns by year for insured cases, ‘self-pay’, Top 10 procedures and demographics.
(Q1 = Jan – Mar; Q2 = Apr – Jun; Q3 = Jul – Sep; Q4 = Oct – Dec)
Private healthcare sector market activity
At a glance
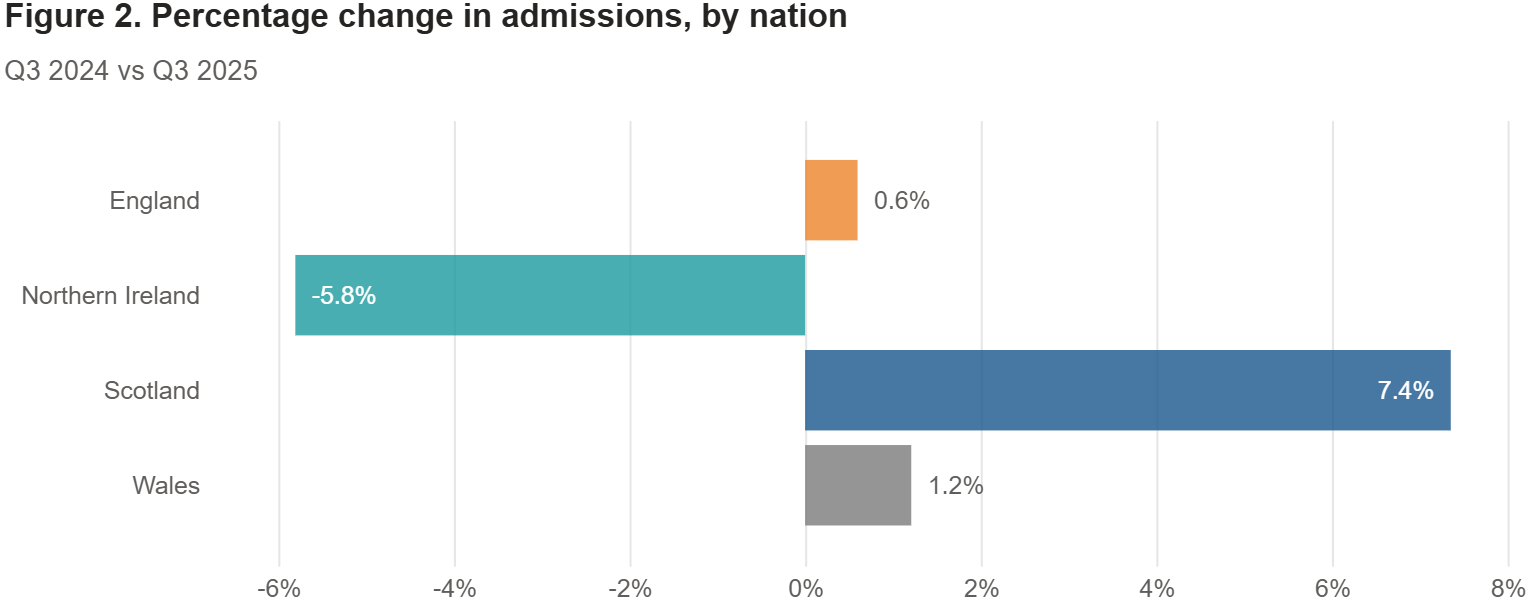
Changes from Q3 2024 to Q3 2025:
- Reported private hospital/clinic admissions were down 6% in Northern Ireland.
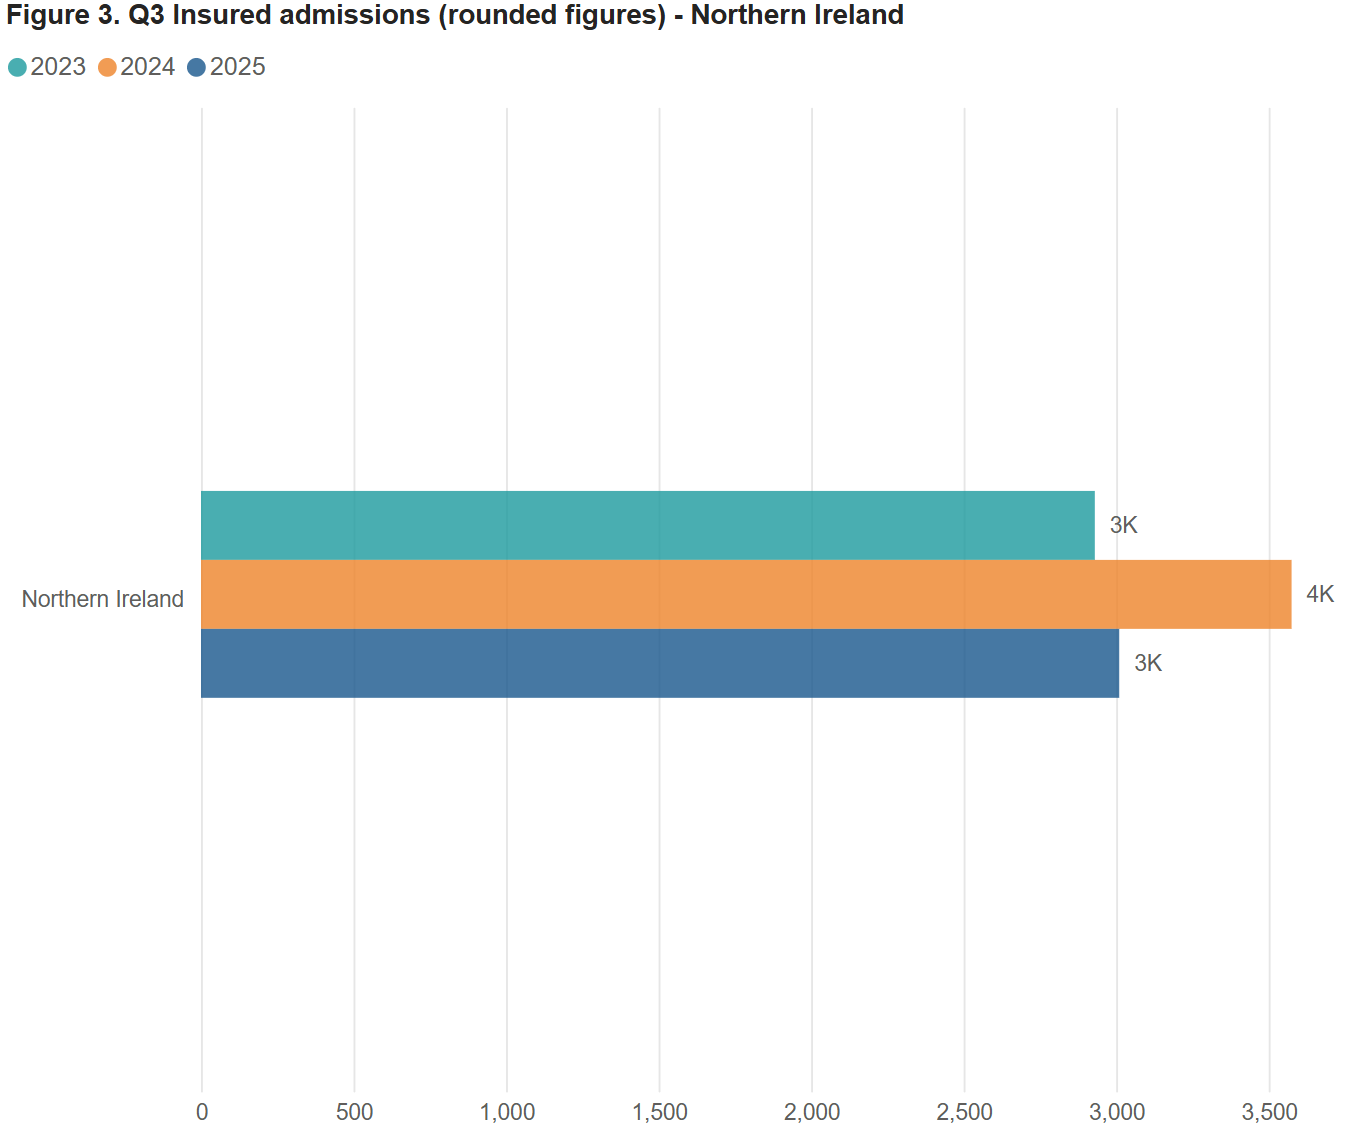
- Private medical insurance admissions decreased by 16%.
- Self-pay admissions increased by 10%.
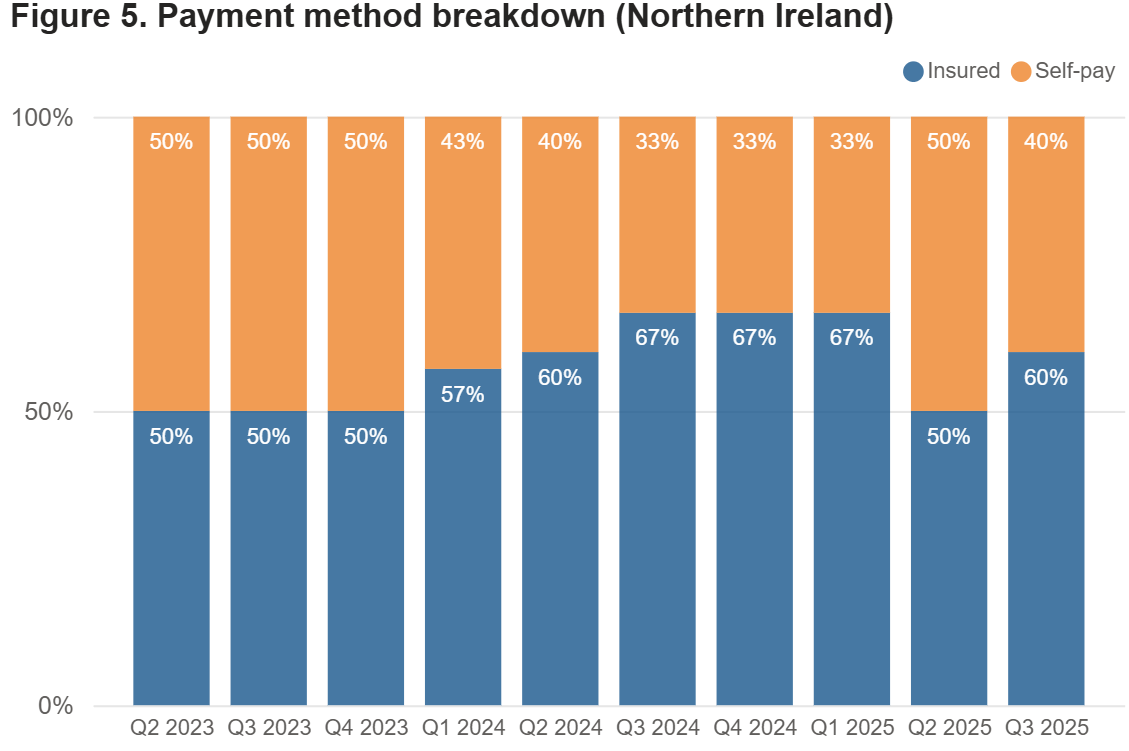
- Funding for admissions was 60% insurance and 40% self-pay.
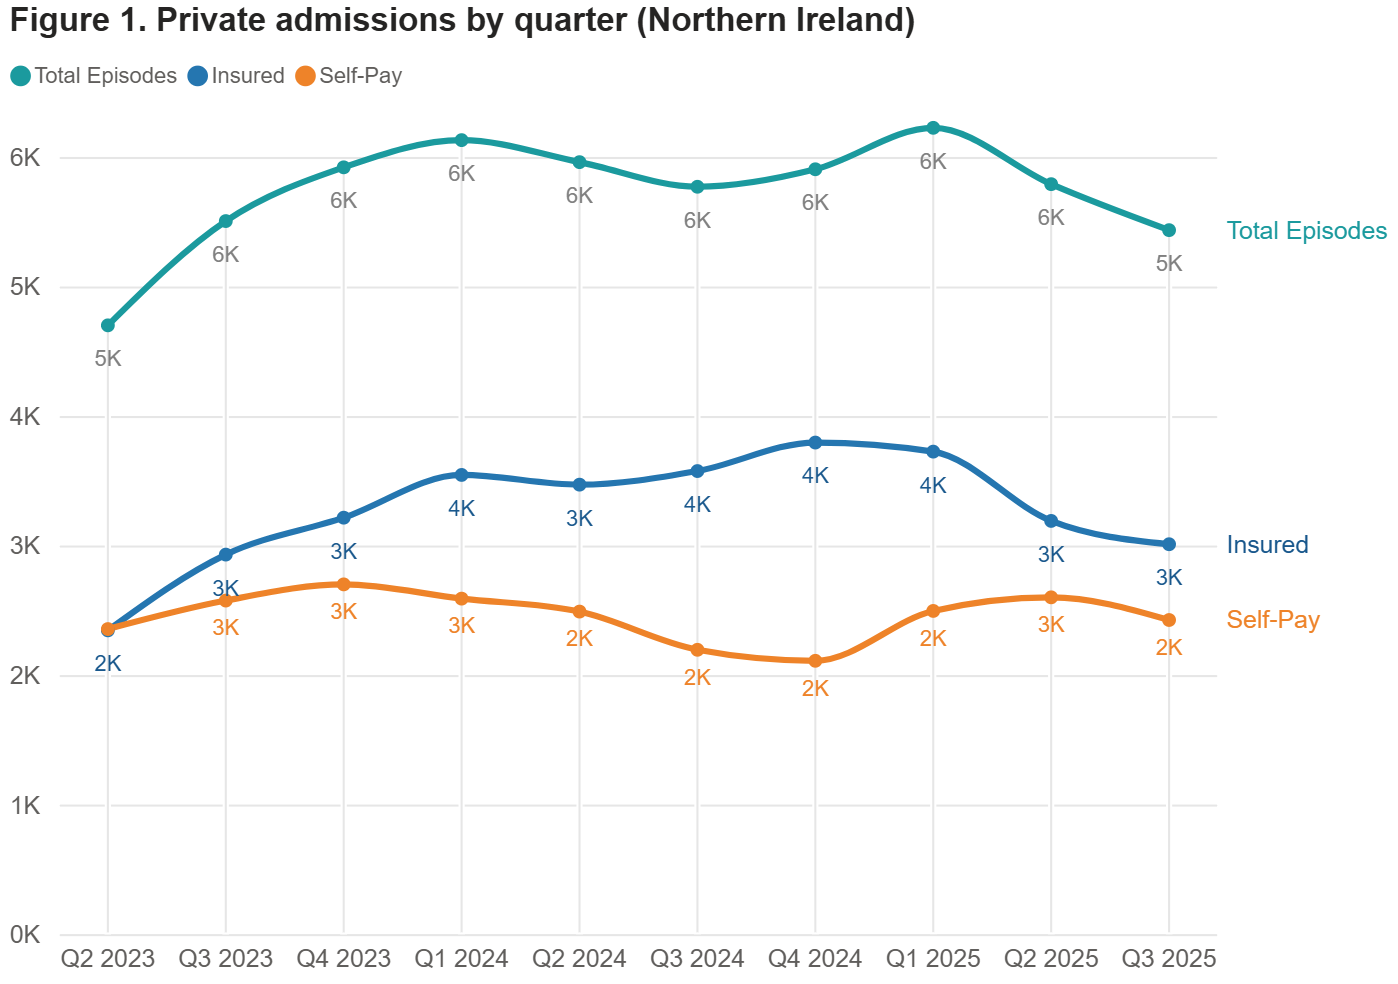
Private healthcare in-patient admissions down in the third quarter of 2025
The total number of admissions in Q3 2025 was 5,435 which is the lowest total since Q2 2023 and 6% below Q3 2024. Northern Ireland is the only nation in the UK to see a decrease in this quarter.
Decrease in insurance funded admissions and increase in self-pay
Insured admissions
Reported admissions paid for with private medical insurance in Q3 2025 decreased by 16% compared to the same period in 2024. There were 565 fewer insured admissions than in Q3 2024 in Northern Ireland.
Insured admissions rose in the other UK nations.
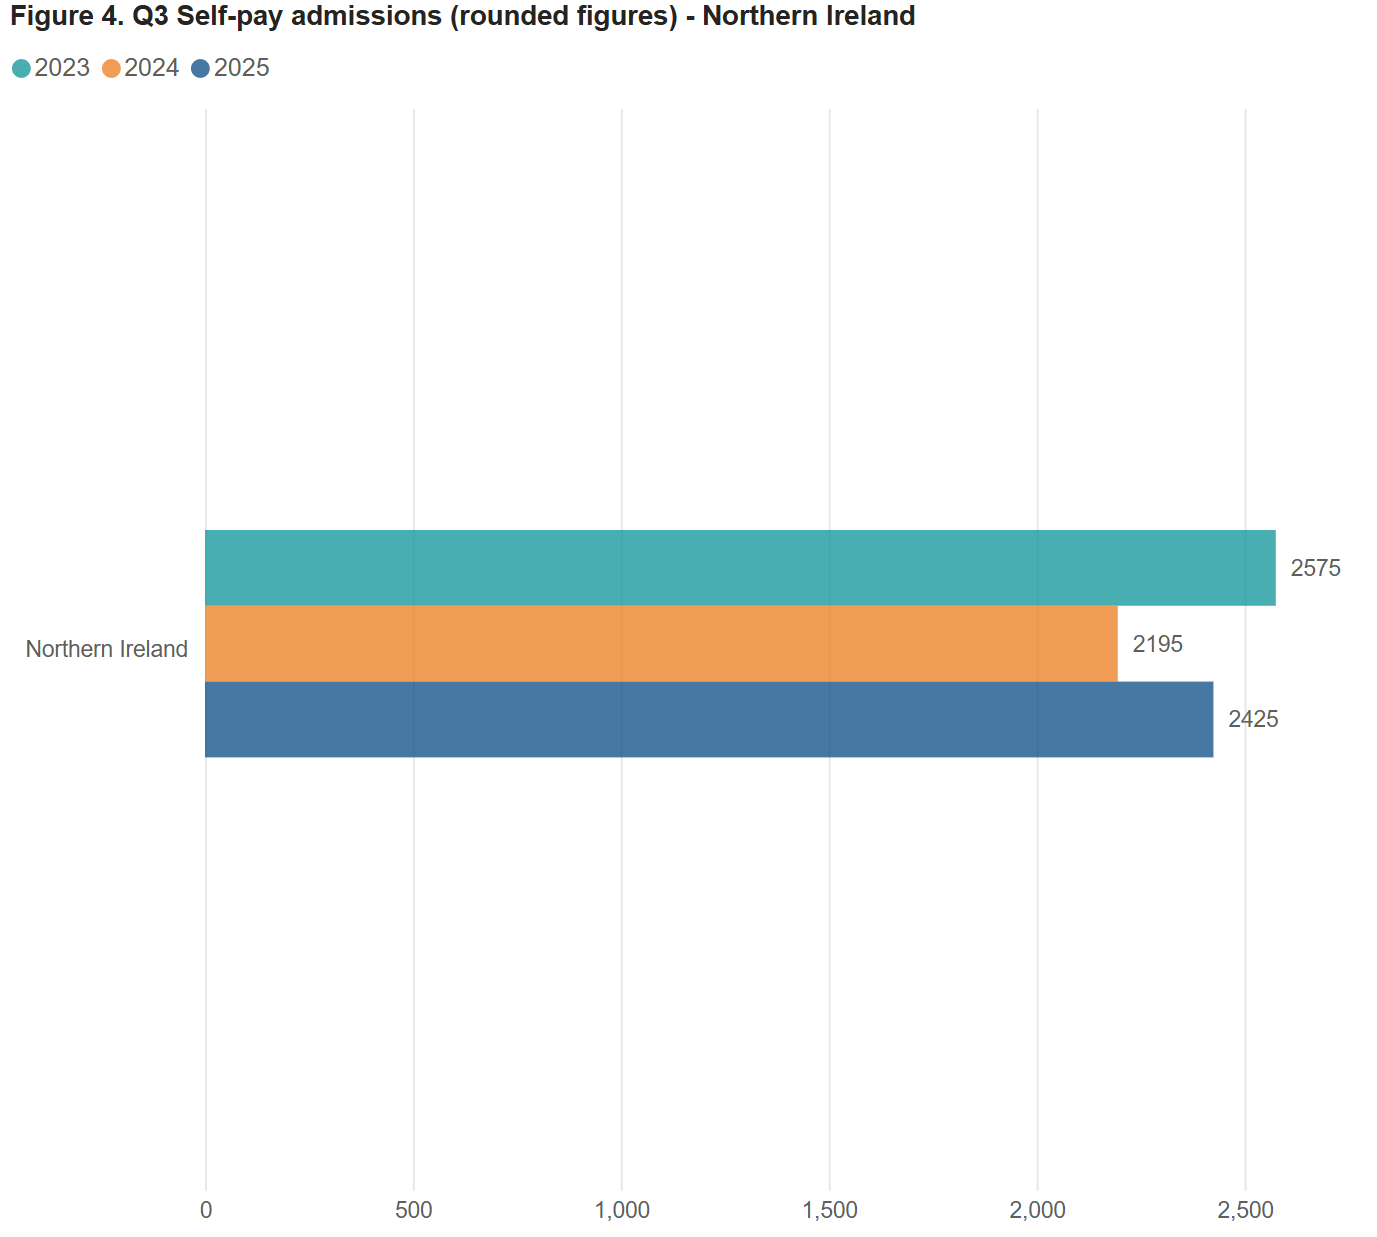
Self-pay admissions
Self-pay admissions in Northern Ireland in Q3 2025 were up by 230 (10%) compared to Q3 2024.
Self-pay was down in England but up in each of the devolved nations.
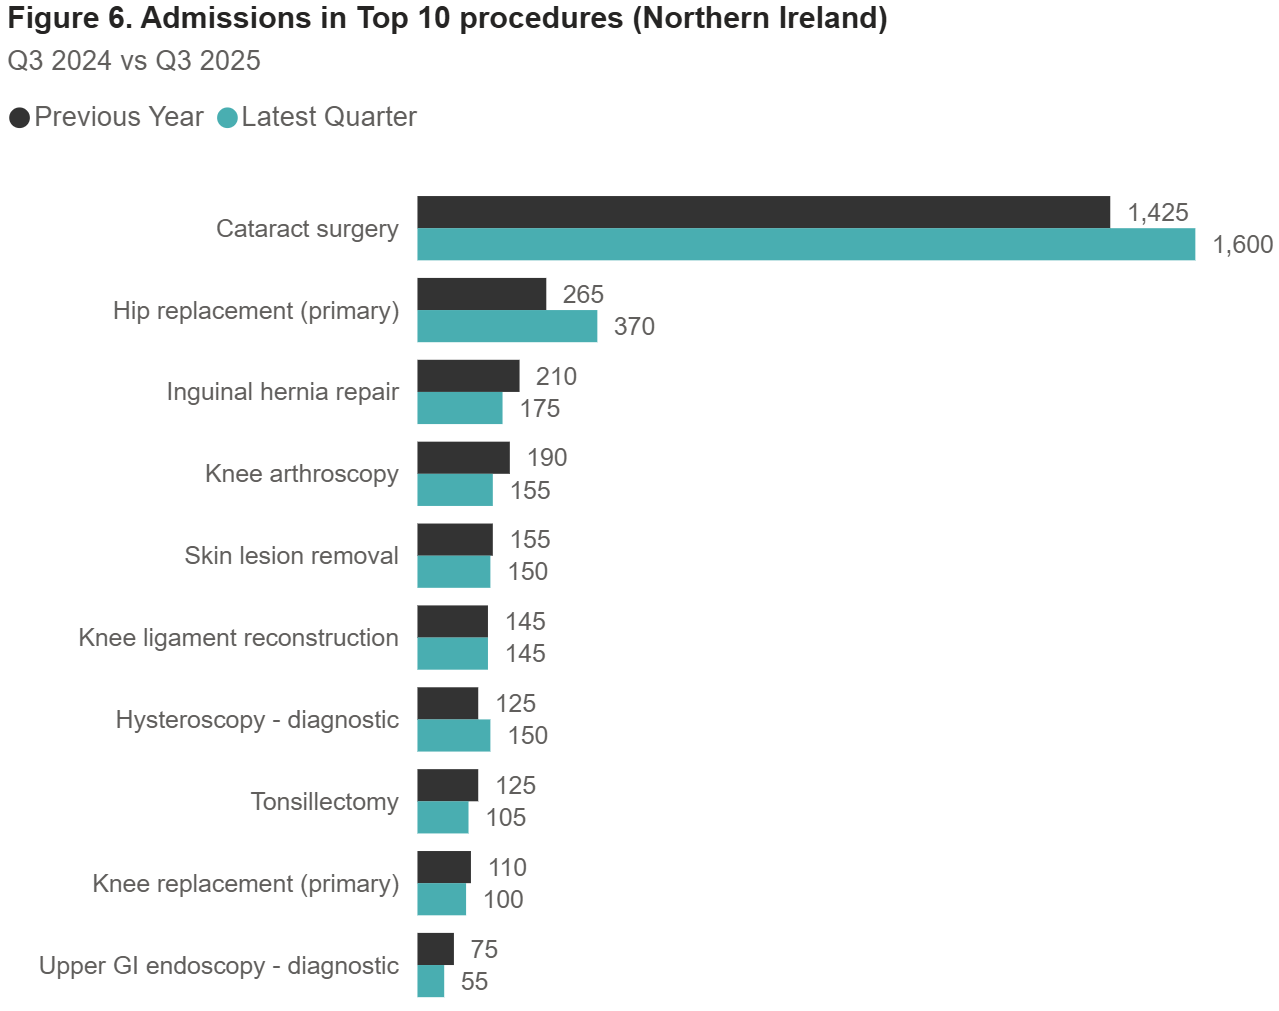
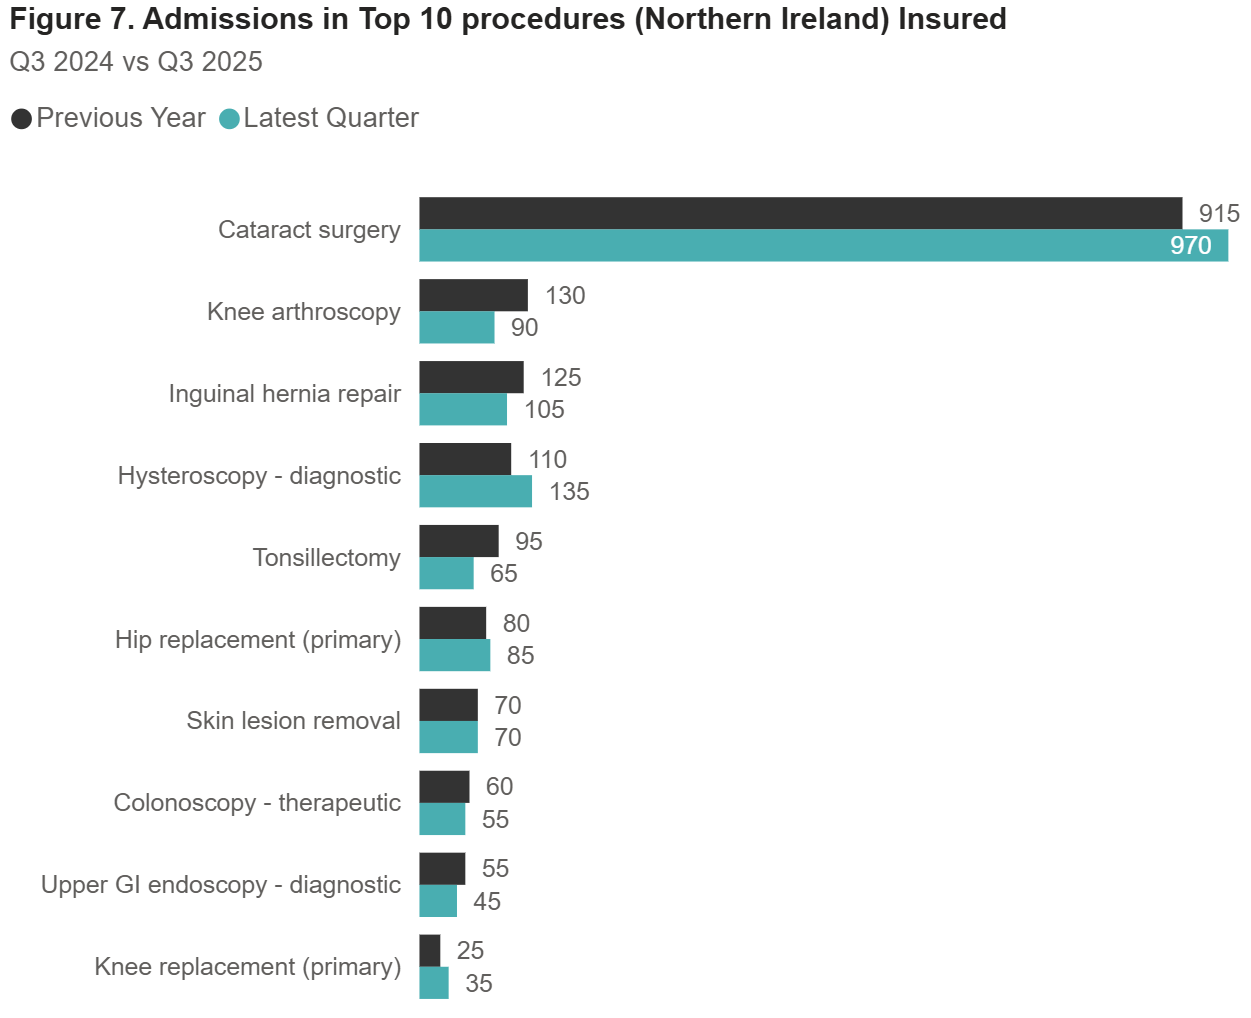
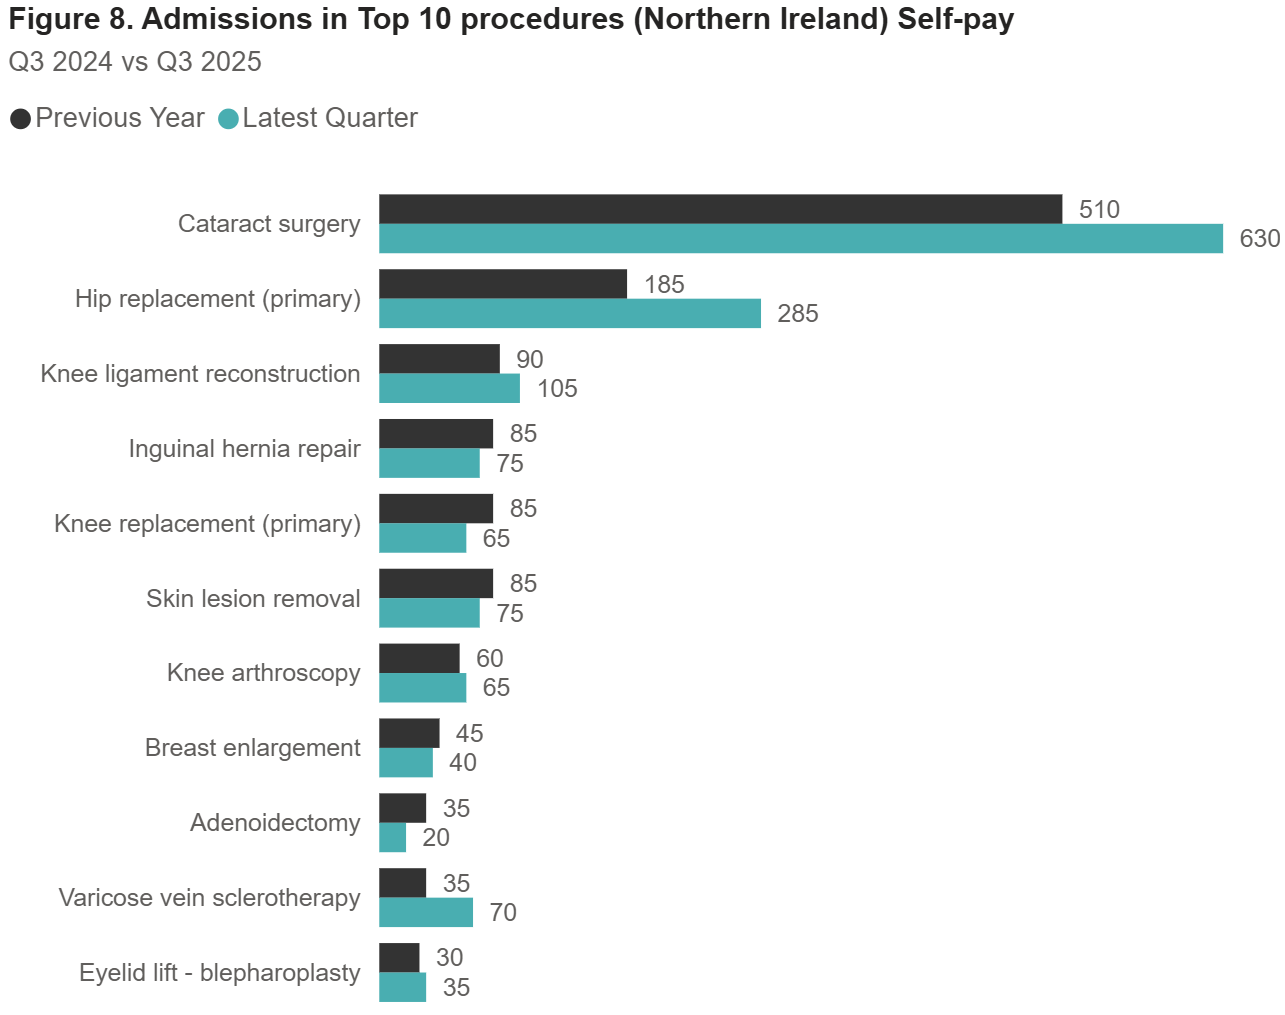
Top 10 procedures
There was an increase in admissions for three of the Top 10 procedures – ‘Cataract surgery’, Hip replacement (primary)’ and ‘Hysteroscopy (diagnostic)’ – by volume when comparing Q3 2025 to Q3 2024.
‘Cataract surgery’ (1,600 admissions) is the largest procedure by volume, and increased by 12.3%. ‘Hip replacement’ (370) is the second highest and increased by 39.6%.
‘Inguinal hernia repair’ and ‘Knee arthroscopy’ both declined by 35.
Active consultants in private healthcare
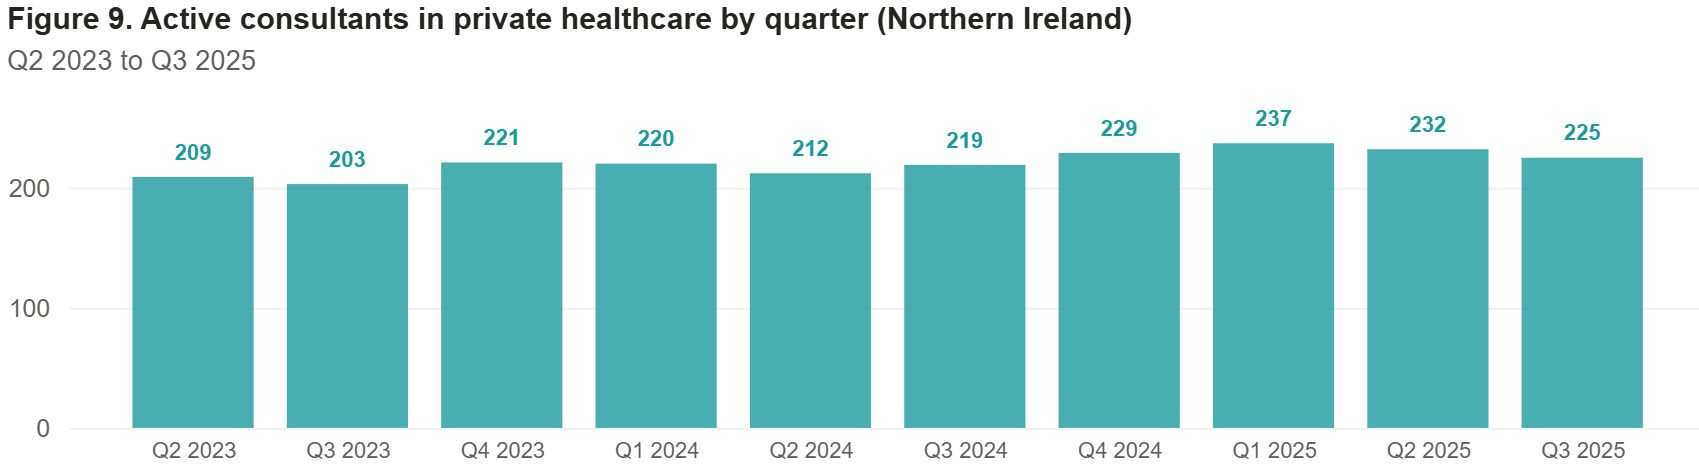
The number of consultants active in private healthcare regularly fluctuates as new consultants start working in the private sector, and existing ones go on sabbatical, stop working privately, or retire.
In Q3 2025 there were 6 more active consultants than in Q3 2024, an increase of 2.7%.
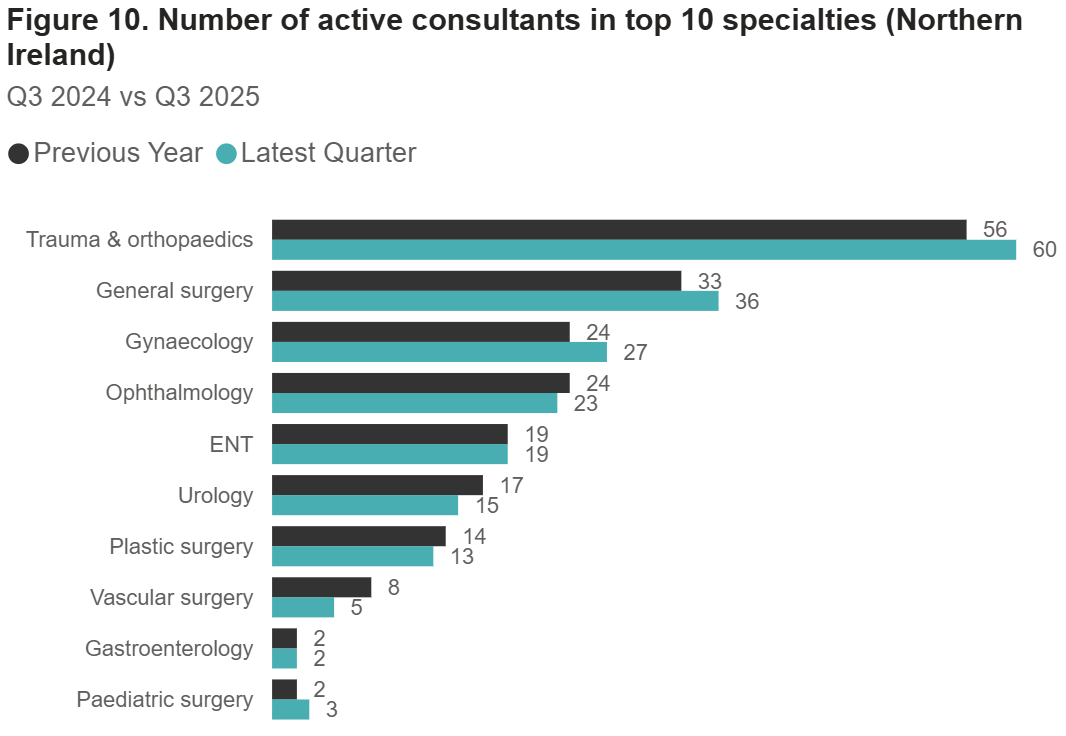
The largest volume increase in active consultants in the top 10 specialties in Q3 2025 was in ‘Trauma & Orthopaedics’ with an extra 4 consultants (7.1%). The biggest increase by percentage was in ‘Gynaecology’ which was up 12.5% (an extra 3 consultants).
‘Vascular surgery’ had the biggest declines by volume (-3) and percentage (37.5%).
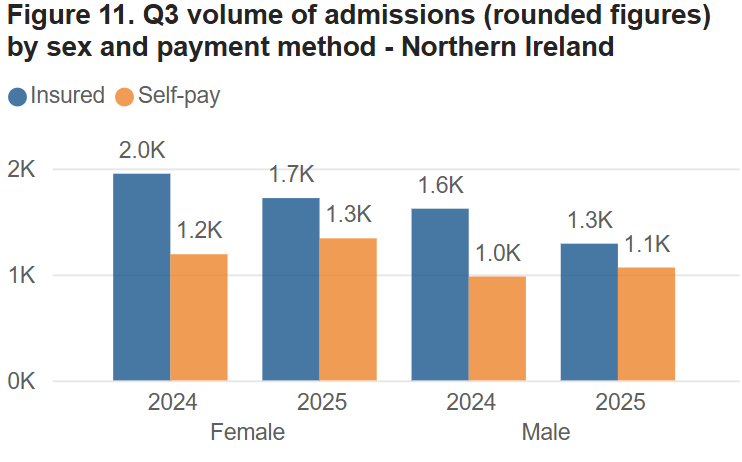
Patient demographics
Looking at insured admissions, there was a decline of 11.8% for female patients and 20.4% for male patients compared to Q3 2024.
Female self-pay funded admissions rose by 12.6% and male admissions were up 8.7%.
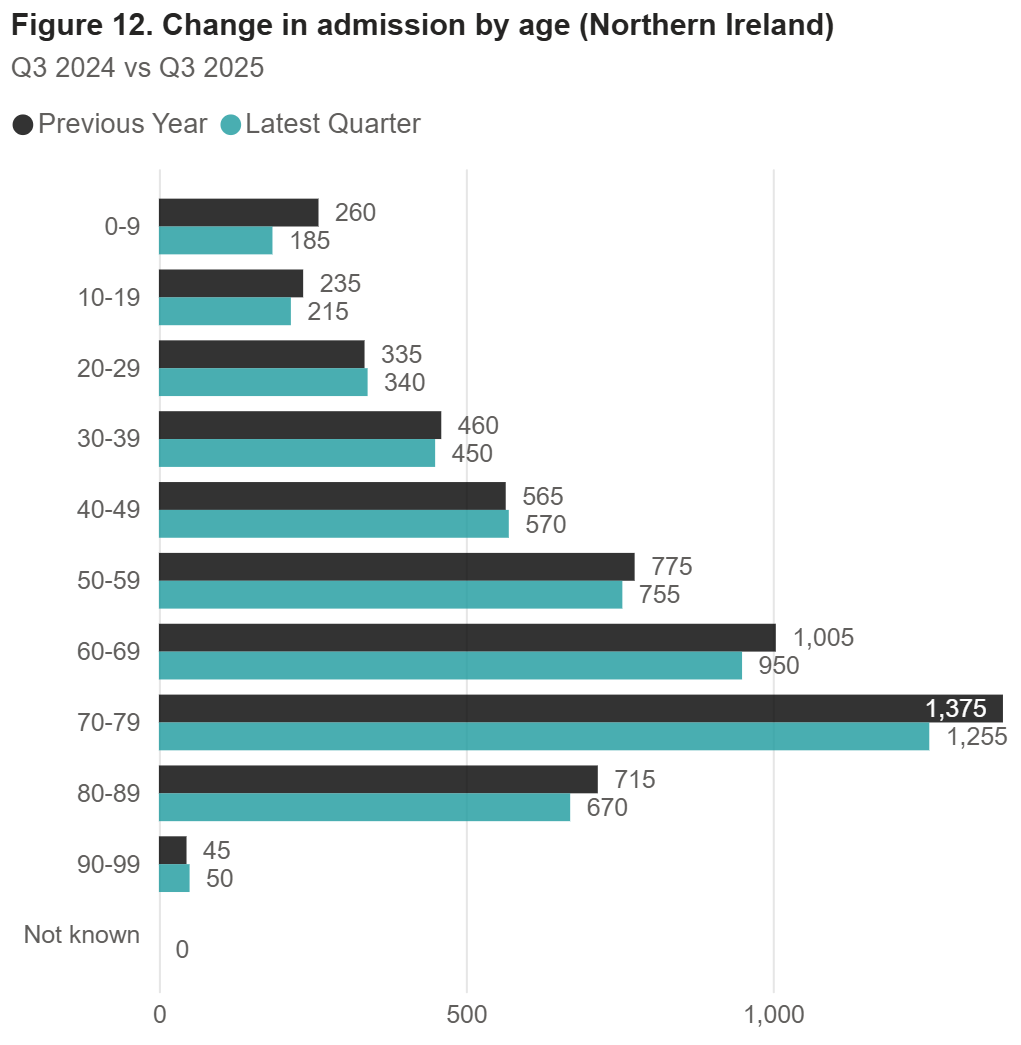
The most admissions (1,255) came for patients in the 70-79 age group, followed by those aged 60-69 (950).
There was a decrease in admissions in all age groups except for the 20-29, 40-49 and 90-99 year olds in Q3 2025 compared to the same quarter in 2024. Those groups all had the same volume increase (5), but this was a larger percentage increase (11%) for the 90-99 year olds.
Conversely, the largest volume decrease (120) was in the 70-79 age group and percentage decrease (29%) was in the 0-9 age group.
Important notes
All data described above is taken from PHIN’s unique, national private dataset describing discharge activity (day case and inpatient). This excludes activity outside of PHIN’s mandate from the Competition and Markets Authority, such as outpatient diagnostics, physiotherapy and mental health services.
There is a time lag between collecting, validating and processing the data we receive from hospitals before we can publish it. This can be up to six months after treatment has been completed, to ensure a fair process and accurate data.
On occasions, hospitals may submit data after our deadline. This will not be included in the current quarter’s Market Update, but will be added to future ones. For this reason, we always recommend only using figures from the latest Update as they can change.
For ease of use, we have reduced the number of years of data shown in the Market Update, if you would like pre-2023 data, please get in touch.
Activity numbers have been rounded to the nearest five, with percentage based on the unrounded figures.