In the latest of our quarterly updates, we use our unique, national dataset to look at the key trends in the independent healthcare sector up to, and including, Q3 2023. The data covers private healthcare in-patient/day-case market activity, insured cases, ‘self-pay’, along with national/regional and procedural breakdowns and demographic information. (Q1 = Jan – Mar; Q2 = Apr – Jun; Q3 = Jul – Sep; Q4 Oct – Dec)
Private healthcare sector market activity
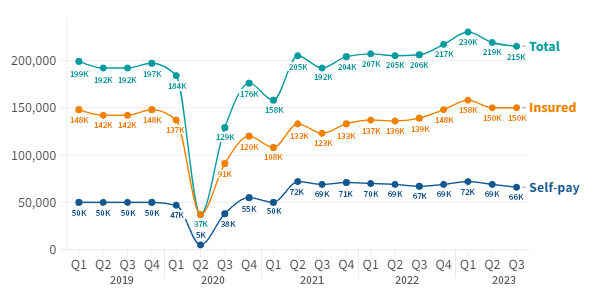
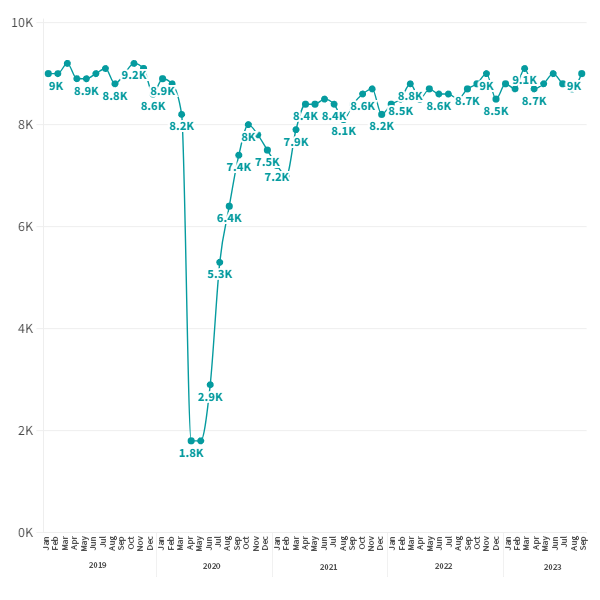
In-patient/day-care admissions comparison Q1 2019 – Q3 2023
At a glance
Q3 2023 v Q3 2022:
- Private admissions up 4% across the UK.
- Self-pay admissions slightly down and now at lowest level since the pandemic.
- Private medical insurance admissions up.
- Diagnostic Endoscopies showed the biggest increases among Top 10 procedures.
On course for record independent healthcare in-patient admissions in 2023
The total number of admissions was 9,000 (4%) above the same quarter in 2022. Although the numbers have dropped each quarter in 2023, the private sector is on track to have had more admissions than in any previous year on record.
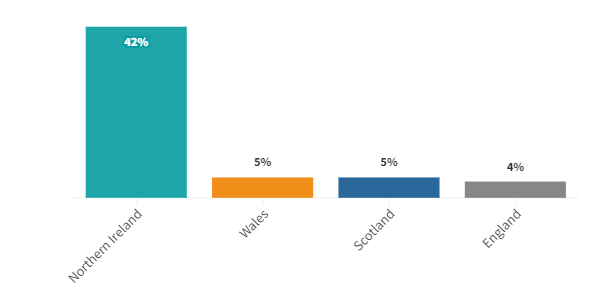
The number of admissions rose in Northern Ireland by 42%, the highest increase by far of any nation. Wales (5%), Scotland (5%) and England (4%) all grew at similar levels.
Percentage change from Q3 2022 to Q3 2023
Private medical insurance admissions remain high, but self-pay admission down to lowest levels post-pandemic
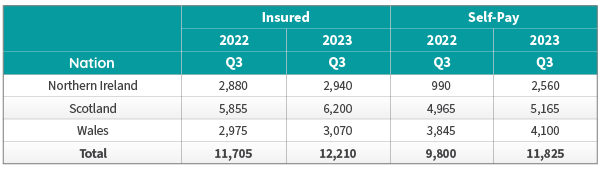
Insured admissions
The number of admissions paid for with private medical insurance remained at the second highest level in PHIN records. There were 11,000 more insured admissions than in the same period in 2022 (8% increase).
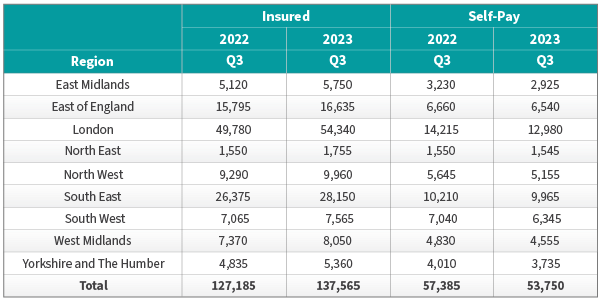
Compared to Q3 2022, the number of admissions using private medical insurance rose in every English region, except the South West where they remained the same. The also rose in Scotland (+6%), Wales (+3%) and Northern Ireland (2%).
The biggest rise in England came in the North East (13%) and East Midlands (12%). The largest rises by volume were in London (4,560) and the South East (1,775).
Self-pay admissions
Self-pay admissions were down by 1,000 (-1.5%) in Q3 2023 compared to Q3 in 2022. This is, in itself, only a small decline, but it means self-pay admissions were at their lowest levels since before the pandemic.
Admissions financed by ‘self-pay’ fell in every English region. The biggest percentage fall in England came in the South West (10%) and London (-9%). Those regions also had the largest fall by volume.
Self-pay continued to grow in the devolved nations: Northern Ireland (159%), Scotland (4%) and Wales (7%).
Admissions by English Region by payment method
Admissions by Devolved Nation by payment method
Top 10 procedures
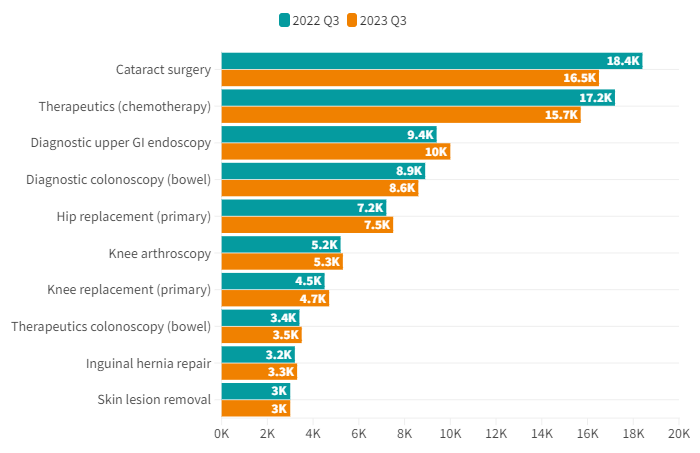
The biggest increases by volume in admissions in the Top 10 procedures were for ‘Diagnostic upper GI endoscopies’. These increased by 600 (6%). The next biggest volume increase was in ‘Hip replacement (Primary) at 300 (4%).
The biggest decrease was in Cataract surgery which was down 1,900 (10%). ‘Therapeutics – Chemotherapy’ also had reduced admissions, it was down 1,500 (8%). Patients require multiple admissions for chemotherapy and the number varies depending on their health and the type and stage of cancer.
Market trends
When looking beyond just the Top 10 procedures, there was a 123% increase in Peripheral nerve blocks (a type of regional anaesthetic) but a fall (-37%) in Paravertebral blocks (a form of local anaesthetic).
There was also a 72% increase in Diagnostics - blood test.
Three types of cosmetic surgeries – Rhinoplasty (28%), Breast enlargement (20%) and Breast implants (19%) – were also down. Cosmetic surgery is nearly always paid for by self-pay and so the fall in these could be related to the fall in self-pay admissions.
Active consultants in private healthcare
The number of consultants active in private healthcare regularly fluctuates and was down 240 (5%) from Q3 2022 to Q3 2023. However, at the end of the quarter (September) there was the joint highest number of active consultants (9,000).
Quarterly comparison of active consultants for the top 10 PHIN specialties
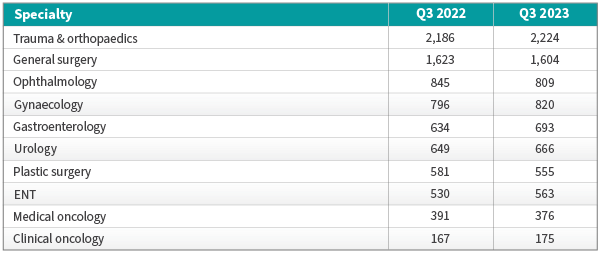
The largest increase in active consultants in the top 10 procedure groups was in ‘Gastroenterology’ with an extra 59 consultants (9%). Three procedures Ophthalmology (-36), Plastic surgery (-26), and Medical oncology (-15) shared the biggest decrease at 4%.
Patient demographics
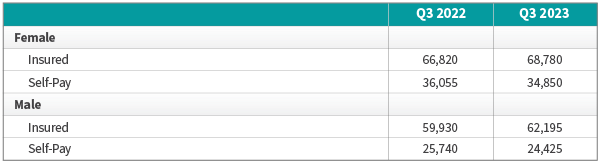
Volume of admissions by sex and payment method
There was an increased number of insured admissions and reduction in self-paid admissions for both sexes compared to the same quarter in 2022.
The drop in self-pay was more pronounced for male admissions at 1,315 (-5%) compared to 1,205 (-3%) for females.
The growth in Insured admissions for males was 2,265 (5%) compared to at 1,960 (3%) for females.
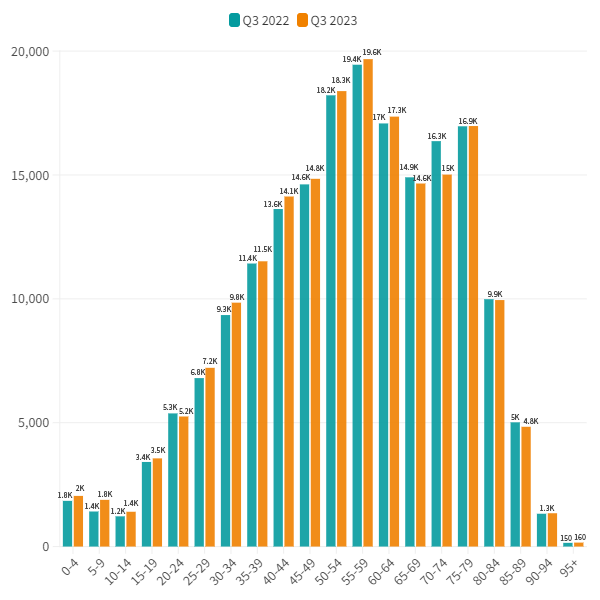
Volume of admissions by age
There was an increase in admissions in all age groups except for 20-24 and 70-74.
Important notes
All data described above taken from PHIN’s unique, national private dataset describing discharge activity (day case and inpatient). This excludes activity outside of PHIN’s mandate from the Competition and Markets Authority, such as outpatient diagnostics and mental health.
There is a time lag between collecting, validating and processing the data we receive from hospitals before we can publish it. This can be up to 6 months after treatment has been completed, to ensure a fair process and accurate data.
Activity numbers have been rounded to the nearest 5, with percentage based on the unrounded figures.