In the latest of our quarterly updates, we use our unique, national dataset to look at the key trends in the private healthcare sector for Q3 2022, including insured cases, ‘self-pay’, national/regional and procedural breakdowns and demographic information. (Q1 = Jan – Mar; Q2 = Apr – Jun; Q3 = Jul – Sep; Q4 Oct – Dec)
Market activity
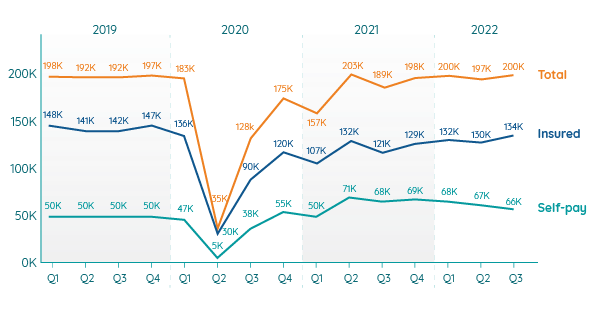
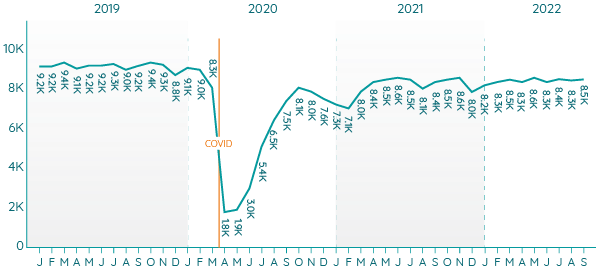
Admissions comparison Q1 2019 – Q3 2022
Overall increase
In Q3 2022 providers reported slightly higher levels of private patient admissions than in the previous quarter. The admissions returned to the levels of Q1 2022.
The Q3 total is 5% higher than the level of activity reported for (pre-pandemic) Q3 2019.
Only once since Q1 2019 has the total number of admissions been higher (in Q2 2021).
Insurance on the up
In Q3 2022, procedures paid for with private medical insurance reached their highest rate since Q1 2020.
Although the quarterly figures remain below pre-pandemic totals, they were only 6% below Q3 2019.
The total increased each month in the quarter and in September insured cases were higher than any month in Q3 2019.
Self-pay growth stalls
‘Self-pay’ rates have declined slightly for the third quarter in a row. However during the quarter they increased month-on-month. They remain well above pre-pandemic levels.
September was the highest month in Q3 2022 for both insured and self-pay admissions.
NHS private patients
Private patient procedures in NHS hospitals are at around half (49%) the level of the equivalent period before the pandemic (Q3 2019).
Strong growth in Wales
For the Top 10 UK procedures, Wales saw the highest rates of growth in both insured and self-pay admissions compared to Q3 2019. For insured procedures in Wales, ‘cataract surgery’ had the highest volume, but ‘therapeutic colonoscopy – bowel’ procedures had the highest growth. ‘Cataract surgery’ had the highest volume of procedures and rate of growth for self-pay procedures in the country.
Private medical insurance to return to pre-pandemic levels?
At 134,000, Q3 2022 reached the highest level of insured admissions since the pandemic. In 2022 admissions were at the highest, joint second highest and third highest levels since 2019.
The month-on-month increase during the quarter suggests this pattern will continue.
The total number of insured procedures at independent sites in Q3 2019 and Q3 2022 was almost equal at 126,000 admissions (figures are rounded). The overall reduction is due to NHS providers performing fewer private procedures in 2022.
What about self-pay?
The growth in self-pay (people paying for their own treatment rather than using insurance) has been a big story since the pandemic. Although there is a reduction in self-pay procedures for the third quarter in a row, at 66,000 the total remains well above the pre-pandemic average of 50,000.
With month-on-month increases in self-pay procedures during the quarter it is too early to say that the boom in self-pay is over.
Insured admissions in the regions
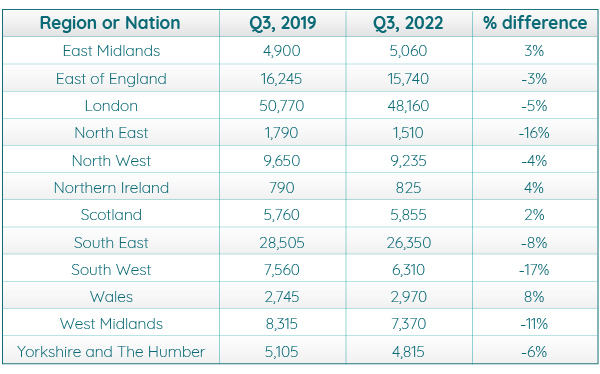
Insured admissions remain down in many of the nations and regions compared to Q3 2019. The South West (-17%) and North East (-16%) maintain the largest differences over the previous levels.
Reflecting the pattern of increasing insured admissions overall, there are areas of growth, the largest of which are Wales (8%) and Northern Ireland (4%).
London and the South East are the regions with the highest number of procedures, but both are down on the levels of insured cases in Q3 2019.
Scotland shows a small increase in insured admissions compared to the 10% reduction in Q2 2022 compared to Q2 2019 reported in the December 2022 Market update.
Self-pay admissions in the regions
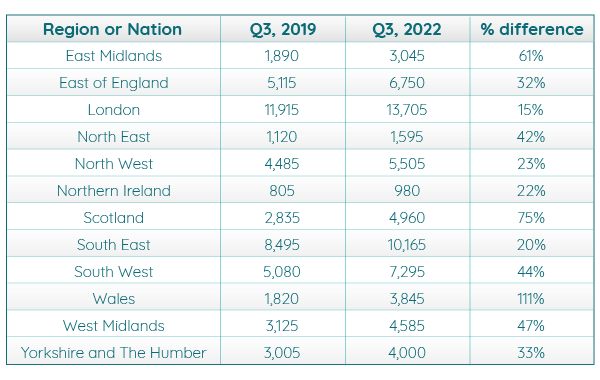
Self-pay admissions were above Q3 2019 figures in all nations and regions with Wales (111%) and Scotland (75%) having the largest increases (as they did in Q2 2022 vs Q2 2019).
London (15%) and the South East (20%) had the lowest percentage increases but the highest total numbers of cases.
Northern Ireland had the next lowest percentage increase and the lowest overall total of self-pay admissions.
Top 10 procedures for Q3 2019 vs Q3 2022
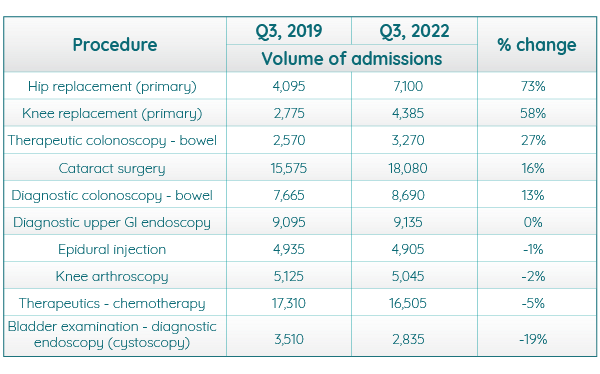
‘Cataract surgery’ was once again the most commonly conducted procedure, but it was only the fourth highest (16%) in terms of change from Q3 2019. ‘Hip replacements’ (73%) and ‘knee replacements’ (58%) showed the largest increases.
‘Bladder examination - diagnostic endoscopy (cystoscopy)’ (-19%) had the most significant reduction, but ‘epidural injection’ (-1%), ‘knee arthroscopy’ (-2%) and ‘therapeutics – chemotherapy’ (-5%) were all at lower rates than the equivalent quarter in 2019.
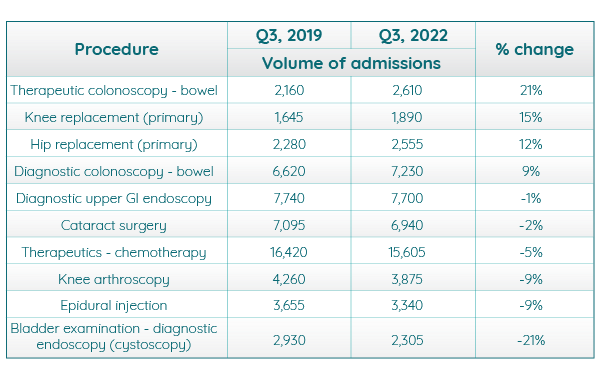
Insured trends for common procedures
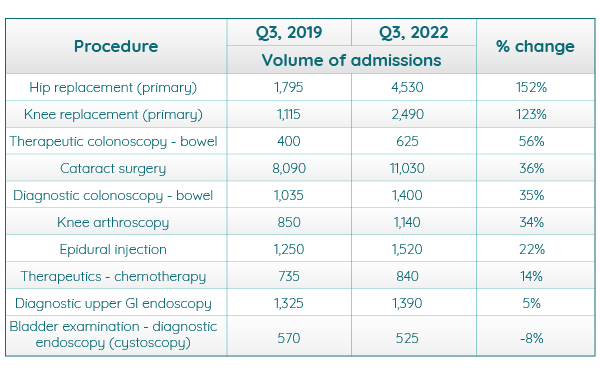
Self-pay trends for common procedures
Active consultants in private healthcare
The number of consultants actively treating private patients was largely consistent with the previous six months of 2022.
Consultants by Top 10 specialties
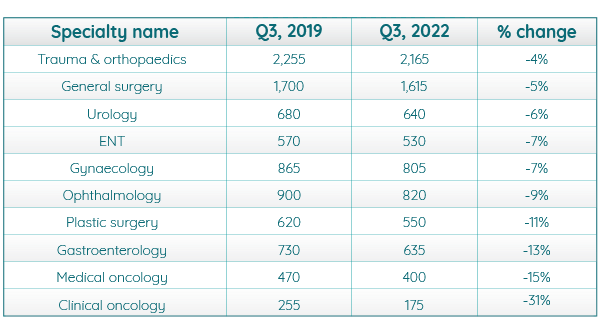
Compared to the same quarter in 2019, there was decrease in the volume of consultants across each of the Top 10 specialties. The biggest decline was in ‘clinical oncology’ (31%) and ‘medical oncology’ (15%). This fall comes despite the overall increase in active consultants as they could be working on procedures outside the Top 10.
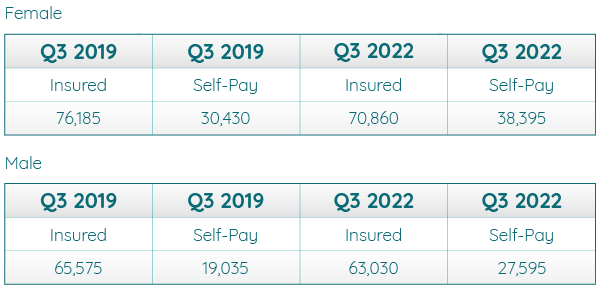
Patient demographics
As in Q3 2019, women made up the larger percentage of private patients for both the self-pay and insured admissions in Q3 2022.
Volume of admissions by gender and payment type
Volume of admissions by age
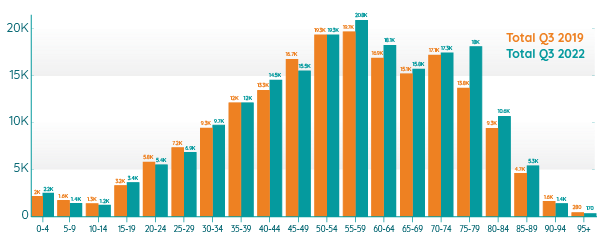
In Q3 in both 2019 and 2022 the most common age to have a procedure was 55 to 59. The largest growth in admissions was for the age range 75 to 79 which saw a 30% increase. The biggest decrease was in the 95+ category which saw a 39% fall from Q3 2019 to Q3 2022.
Important notes
All data described above taken from PHIN’s unique, national private dataset describing discharge activity (day case and inpatient). This excludes activity outside of PHIN’s mandate from the Competition and Markets Authority, such as outpatient diagnostics and mental health.
There is a time lag between collecting, validating and processing the data we receive from hospitals before we can publish it. This can be up to 6 months after treatment has been completed, to ensure a fair process and accurate data.
Activity numbers have been rounded to the nearest 5, with percentage based on the unrounded figures.