In the latest of our quarterly updates, we use our unique, national dataset to provide a comprehensive view of the key trends in the independent healthcare sector in Wales up to, and including, the end of 2024. (Q1 = Jan – Mar; Q2 = Apr – Jun; Q3 = Jul – Sep; Q4 Oct – Dec)
Private healthcare sector market activity in Wales
At a glance
Changes from 2023 to 2024 in Wales:
- Total reported private hospital/clinic admissions were up 6%.
- Private medical insurance admissions were up 9% to new record level.
- Self-pay admissions up 4% and also at a record level.
- Fourth consecutive year of growth for all three metrics.
Changes from 2019 (pre-pandemic) to 2024 in Wales:
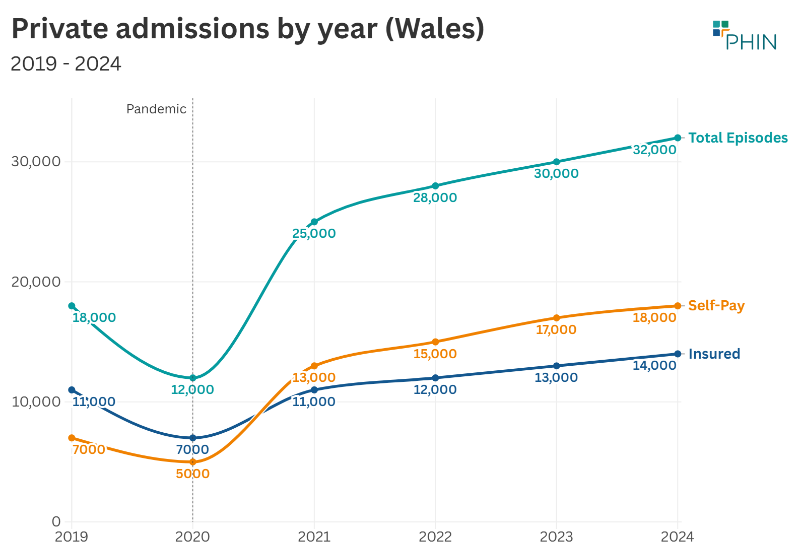
- Private admissions up 74%.
- Insured admissions up 23% and self-pay up 152%.
%20@2x.png)
Record independent healthcare in-patient admissions in 2024
The total number of admissions in 2024 was 32,000 (6% above 2023) meaning the private sector in Wales had more admissions than in any previous year on record for the fourth year in a row.
Every quarter 2024 had a record number of admissions compared to the equivalent quarters in previous years.
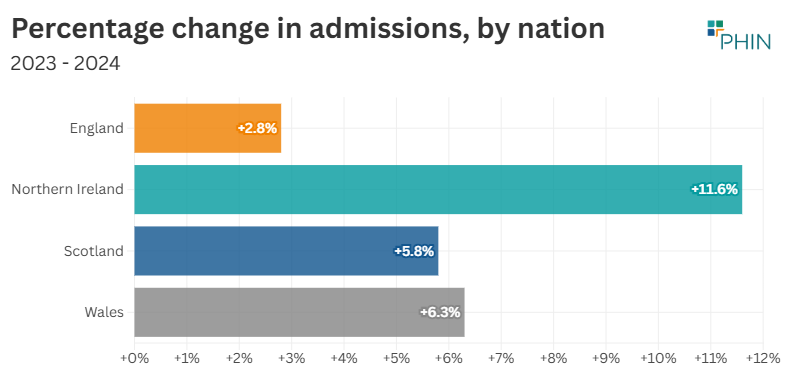
The 6% increase in admissions in Wales (+1,900 admissions) was matched in Scotland (+2,700) and higher than England (3%), although England had a higher volume increase. At 12% Northern Ireland had the highest percentage increase of any nation.
Private medical insurance funded admissions driving growth, but self-pay funded admissions still high
Insured admissions
Admissions funded by private medical insurance were higher in every quarter than in any previous period, leading to a record annual figure (3,400 admissions).
There were over 1,000 more insured admissions than in 2023 (9% increase).
Self-pay admissions
Self-pay admissions in 2024 also increased compared to 2023. In Q1 (Jan to Mar) and Q2 (Apr to June) 2024, there were more self-pay funded admissions in Wales than in any other quarter on record.
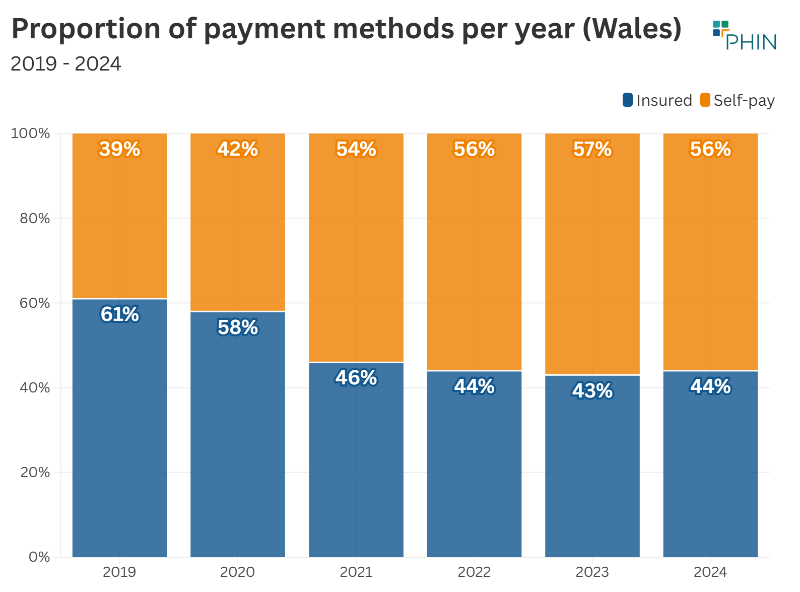
Self-pay admissions are down across most of the UK, with only London and Wales seeing increases. Wales continues to be the only UK country with more self-pay than insured admissions.
The proportion of admissions funded by insurance or self-pay has varied over the years, but has only varied by 3% in Wales over the past four years.
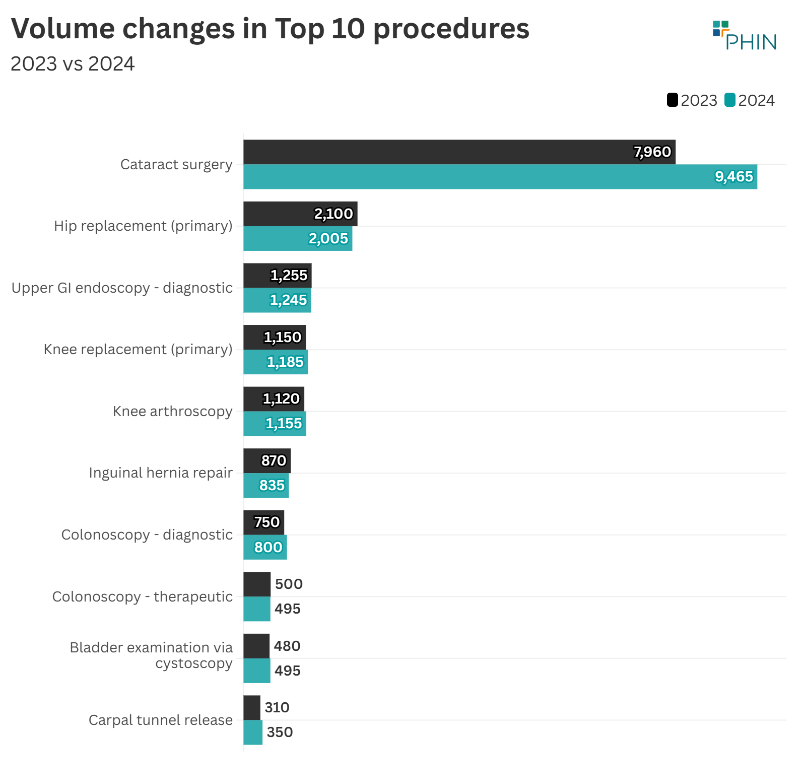
Top 10 procedures Wales
The number of admissions increased in six of the Top 10 most popular procedures, but fell in the other four. The highest rise in admissions was for ‘Cataract surgery’ at 19%. There was an increase of 1,505 in the number of admissions. Outside the Top 10, there was also a large increase (400%) for surgical glaucoma treatment e.g. trabeculotomy.
‘Hip replacement (primary) fell by the highest percentage (5%). This could have been due to the fact PHIN now reports the robot-assisted version of this procedure separately. However, the robot assisted version was also down (55%) so it does appear that fewer patients are receiving this procedure.
%20Wales@2x.png)
%20Wales@2x.png)
@2x.png)
The number of consultants active in private healthcare regularly fluctuates as new consultants start working in the private sector, and existing ones go on sabbatical, stop working privately, or retire. The number of active consultants in Wales in 2024 has increased over the past three years and 2024 was at the highest level since before the pandemic.
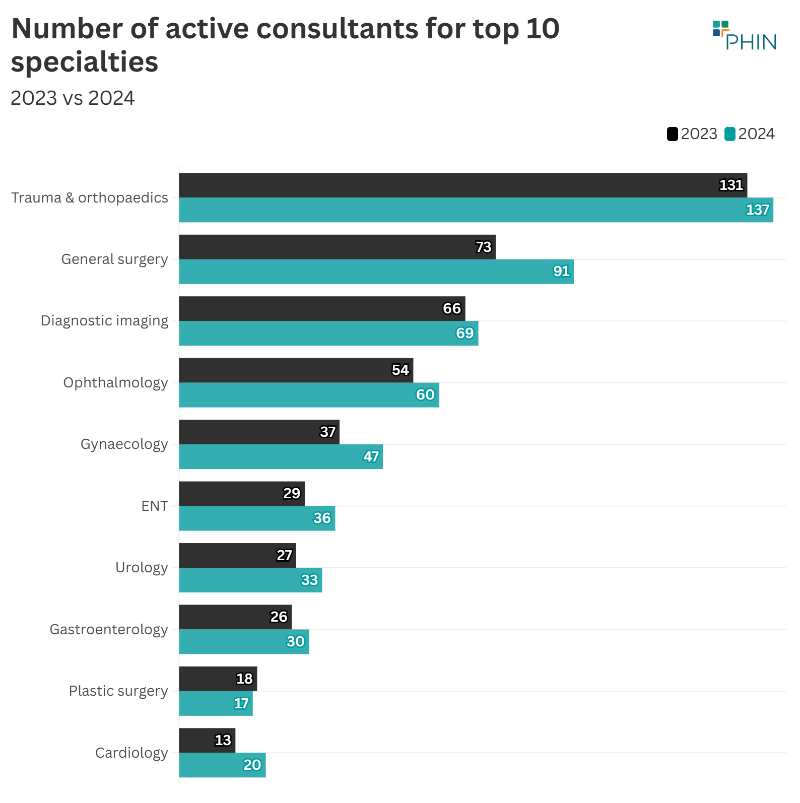
The number of consultants working increased in all but one of the Top 10 specialties.
The largest volume increase was in ‘General surgery’ with an extra 18 consultants (25%). The percentage increase was in ‘Gynaecology’ at 27% (10 additional consultants).
There were 137 consultants working in ‘Trauma and orthopaedics’ in Wales. This is just over a third of the total consultants working in the private sector in Wales.
Patient demographics
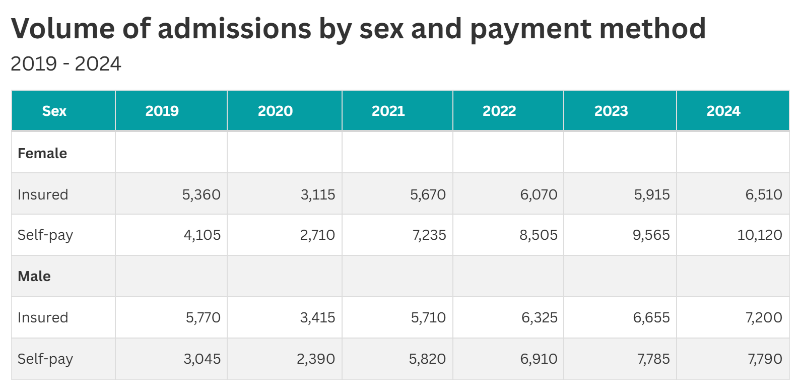
Payment method
There was an increased number of insured admissions for both sexes in 2024 compared to 2023. Insured funded admissions for female patients increased by 10% and those for male patients by 8%.
Female self-pay funded admissions fell 6% while the number of male admissions increased by less than 1%.
Volume of admissions by age
There was an increase in admissions in all age groups between 20 to 29 and 90 to 99 in 2024 compared to the previous year. The largest volume increase (600) and percentage increase (14%) was in the 80 to 89 age group. The only age group with fewer admissions that the previous year was the 0 to 9 group (-4%).
@2x.png)
Important notes
All data described above taken from PHIN’s unique, national private dataset describing discharge activity (day case and inpatient). This excludes activity outside of PHIN’s mandate from the Competition and Markets Authority, such as outpatient diagnostics, physiotherapy and mental health services.
There is a time lag between collecting, validating and processing the data we receive from hospitals before we can publish it. This can be up to 6 months after treatment has been completed, to ensure a fair process and accurate data.
Activity numbers have been rounded to the nearest 5, with percentage based on the unrounded figures.