In the latest of our quarterly updates, we use our unique, national dataset to look at the key trends in the independent healthcare sector up to, and including, the end of 2023. The data covers private healthcare in-patient/day-case market activity, insured cases, ‘self-pay’, along with national/regional and procedural breakdowns and demographic information. (Q1 = Jan – Mar; Q2 = Apr – Jun; Q3 = Jul – Sep; Q4 Oct – Dec)
Private healthcare sector market activity
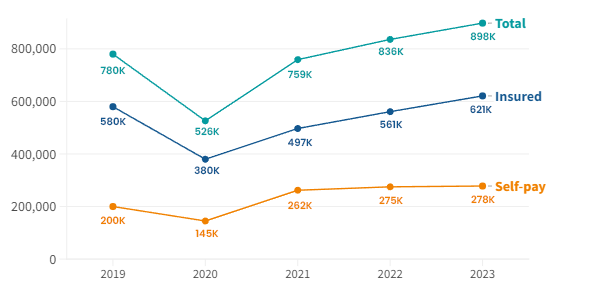
Private hospital admissions by year 2019-2023
At a glance
2023 v 2022:
- Private admissions up 7% across the UK.
- Self-pay admissions up 1% and at highest level ever.
- Private medical insurance admissions up 11% and also at record levels.
- Second year in a row admissions at above pre-pandemic levels.
- 2022 had previously been a record year.
2023 v 2019 (pre-pandemic)
- Private admissions up 15% across the UK.
- Self-pay up 39%.
- Insured admissions up 7%.
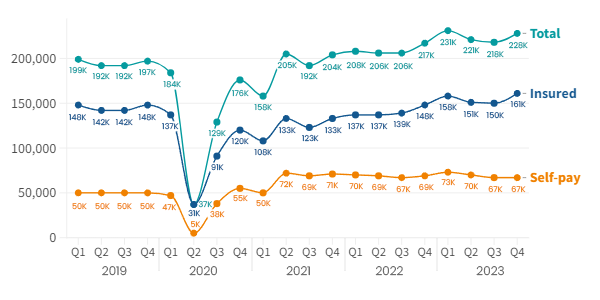
In-patient/day-care admissions comparison Q1 2019 – Q4 2023
Record independent healthcare in-patient admissions in 2023
The total number of admissions in 2023 was 898,000 (7% above 2022) meaning the private sector had more admissions than in any previous year on record.
Although quarter 4 2023 reflected the annual pattern and was 5% above the equivalent quarter in 2022, with insured admissions up 9%, self-pay admissions were down slightly (2%).
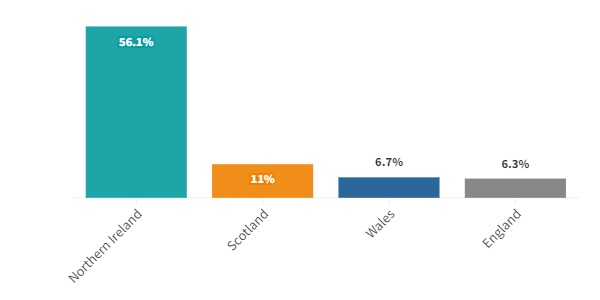
For the year as a whole, the number of admissions rose in Northern Ireland by 56%, the highest increase by far of any nation. Wales (7%), Scotland (11%) and England (6%) all grew at similar levels.
Percentage change from 2022 to 2023 by Nation
Private medical insurance and self-pay admissions at record annual levels
Insured admissions
The number of admissions paid for with private medical insurance was at the highest level ever in Q4 2023, contributing to the record annual figure. There were 13,000 more insured admissions than in the same period in 2022 (9% increase) and across the year there were 60,000 more insured admissions than in 2022 (11% increase).
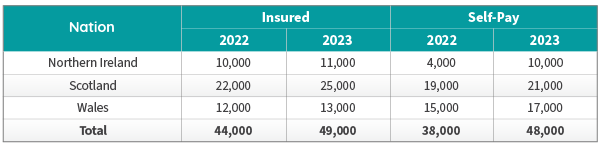
Compared to 2022, the number of admissions using private medical insurance rose in every English region (11% for the whole of England). The also rose in Scotland (13%), Wales (1%) and Northern Ireland (17%).
The biggest rises for Insured admissions in England came in the East Midlands (14%) and London (12%). The largest rises by volume were in London (23,800) and the South East (8,600) followed by the East of England (6,700).
Self-pay admissions
Self-pay admissions were down by 2,000 (-2%) in Q4 2023 compared to Q4 in 2022. This small decline by quarter was not reflected in the annual total which was higher than 2022, largely thanks to the record levels in Q1 2023. Overall, self-pay admissions were up by 3,000 (1%) across the year.
In 2023, admissions financed by ‘self-pay’ fell in every English region compared to 2022 levels, except the East of England (4%) and the North East (5%). The biggest percentage fall in England came in the East Midlands (-7%) and the North West (-7%). London and the North West had the largest fall by volume.
Admissions by English Region by payment method (rounded figures)
%202022%20v%202023.png)
Self-pay continued to grow in the devolved nations in 2023: Northern Ireland (144%), Scotland (8%) and Wales (11%) were all above 2022 figures.
Admissions by Devolved Nation by payment method
Top 10 procedures UK (2022 v 2023)
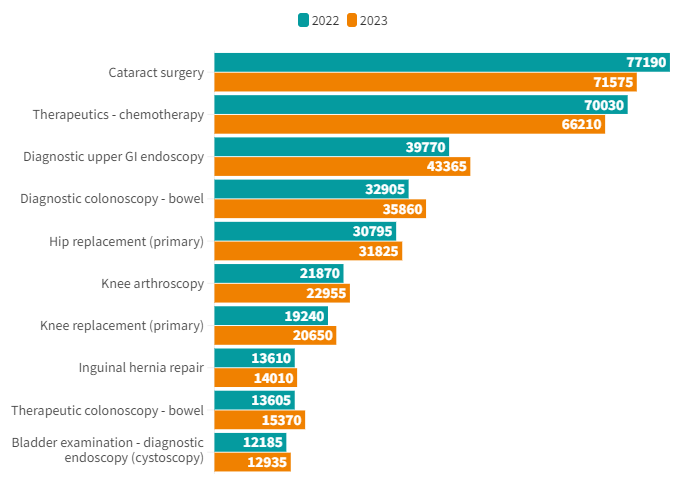
The biggest increases by volume in admissions in the Top 10 procedures were for ‘Diagnostic upper GI endoscopies’. These increased by 3,595 (9%). The next biggest volume increase was in ‘Diagnostic colonoscopy - bowel at 2,955 (9%).
The biggest decrease was in Cataract surgery which was -5,615 (7%). Therapeutics – chemotherapy were also down (5.5%).
Market trends from 2022 to 2023
When looking beyond just the Top 10 procedures, there was a 99% increase in Peripheral nerve blocks (a type of regional anaesthetic) but a fall (-25%) in Spinal injections (a form of local anaesthetic).
Three types of cosmetic surgeries – Rhinoplasty (-16%), Septorhinoplasty (-11%) and Breast enlargement (-11%) – were also down. Cosmetic surgery is nearly always paid for by self-pay and so the fall in these could be related to the cost-of-living crisis.
Active consultants in private healthcare by year
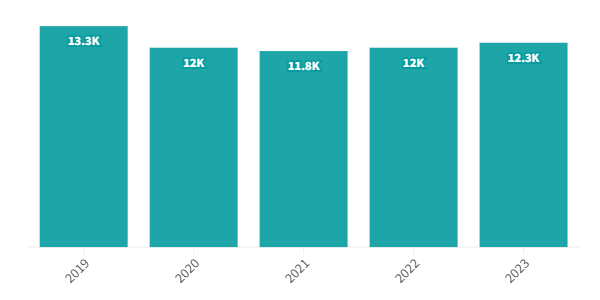
The number of consultants active in private healthcare regularly fluctuates and was at the highest level since the pandemic in 2023.
Comparison of active consultants for the top 10 PHIN specialties (2022 v 2023)
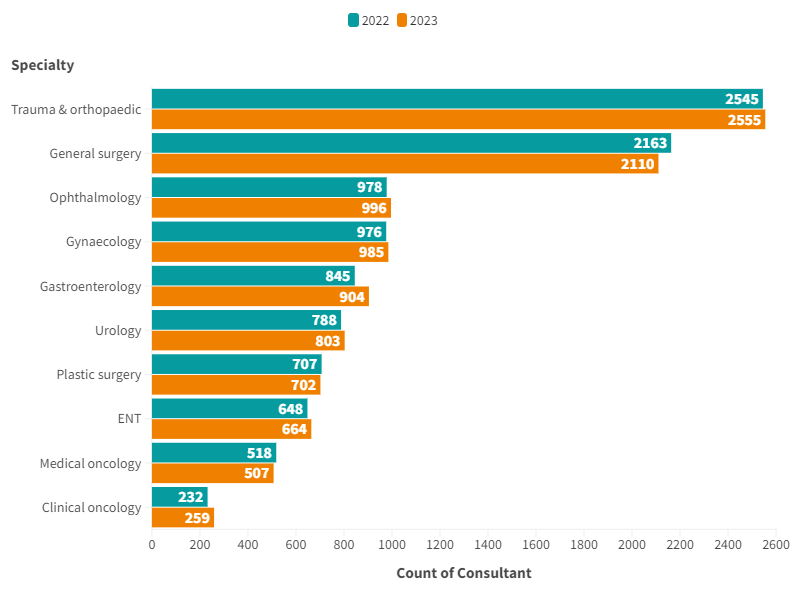
The largest increase in active consultants in the top 10 procedure groups was in ‘Gastroenterology’ with an extra 59 consultants (7%). Clinical Oncology had the largest percentage increase (12%). Three procedures General Surgery (-2%), Plastic surgery (-1%), and Medical oncology (-2%) had fewer active consultants than in 2022.
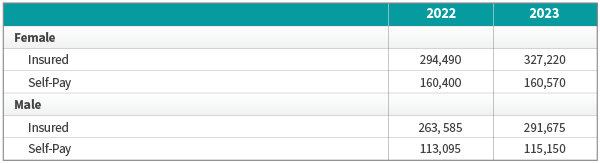
Patient demographics
Volume of admissions by sex and payment method
There was an increased number of insured admissions and self-pay admissions for both sexes in 2023 compared to 2022.
Insured admissions were up equally for both sexes at 10% compared to 2022.
Self-pay grew slightly (2%) for male admissions but remained the same for female admissions in 2023.
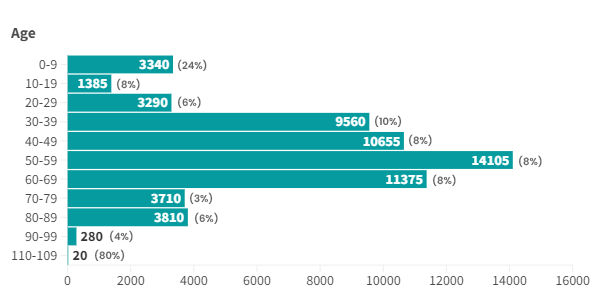
Volume of admissions by age
There was an increase in admissions in all age groups in 2023 compared to the previous year. The largest percentage increases were in the 100-109 (80%) and 30-39 (10%) age groups.
The most common age group for private admissions was 50-59 (14,105 more admissions than 2022).
Important notes
All data described above taken from PHIN’s unique, national private dataset describing discharge activity (day case and inpatient). This excludes activity outside of PHIN’s mandate from the Competition and Markets Authority, such as outpatient diagnostics, physiotherapy and mental health services.
There is a time lag between collecting, validating and processing the data we receive from hospitals before we can publish it. This can be up to 6 months after treatment has been completed, to ensure a fair process and accurate data.
Activity numbers have been rounded to the nearest 5, with percentage based on the unrounded figures.