In the latest of our quarterly updates, we use our unique, national dataset to look at the key trends in the independent healthcare sector up to, and including, Q2 2023. The data covers private healthcare in-patient/day-case market activity, insured cases, ‘self-pay’, along with national/regional and procedural breakdowns and demographic information. (Q1 = Jan – Mar; Q2 = Apr – Jun; Q3 = Jul – Sep; Q4 Oct – Dec)
Private healthcare sector market activity
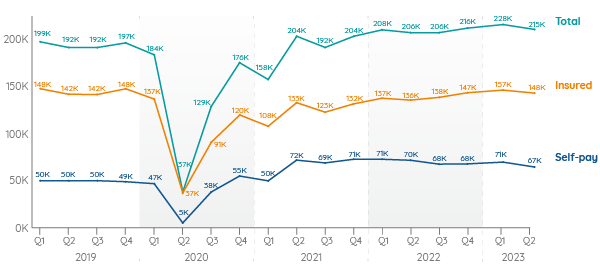
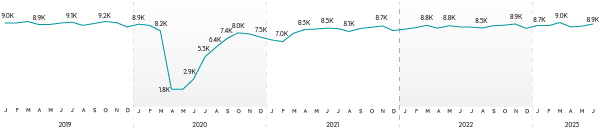
In-patient/day-care admissions comparison Q1 2019 – Q2 2023
At a glance
Q2 2023 v Q2 2022:
- Private admissions up in all nations.
- Private medical insurance admissions up and self-pay admissions down.
- Drop in self-pay more pronounced for female admissions.
- Diagnostic procedures have the biggest increases among Top 10 procedures (based on primary PHIN procedure group of episodes).
High numbers of independent healthcare in-patient admissions for Q2
The total number of admissions was 9,000 (4%) above the same quarter in 2022. However, in common with previous non-Covid impacted years, there was a dip in private admissions in Q2 compared to Q1.
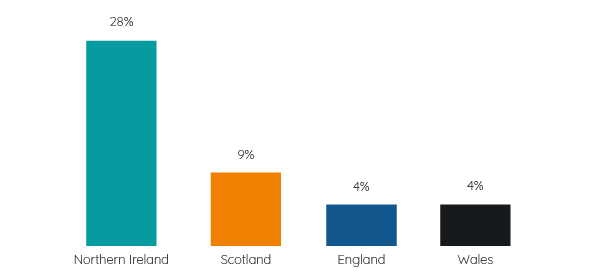
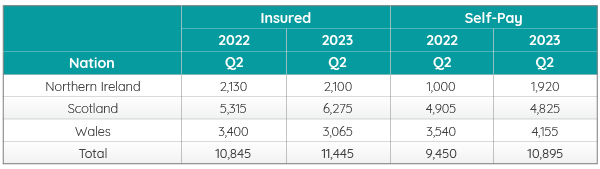
Overall, there was a growth in total admissions in every nation, compared to the same quarter in 2022. Northern Ireland grew by the highest percentage (28%), from the lowest base.
Percentage change from Q2 2022 to Q2 2023
Widespread growth in admissions paid for with private medical insurance, but has self-pay reached its limits in England and Scotland?
Insured admissions
The number of admissions paid for with private medical insurance was at the second highest level in PHIN records and there were 12,000 more insured admissions than in the same period in 2022 (9% increase).
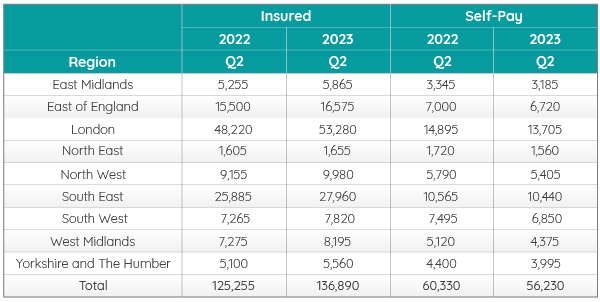
Compared to Q2 2022, the number of admissions using private medical insurance rose in every English region and in Scotland (+18%) in Q2 2023. The biggest rise in England came in the West Midlands (13%) and the smallest in the North East (3%). The largest rise by volume was in London (5,060).
Comparing the two periods, insured admissions only fell in Wales (10%) and very slightly in Northern Ireland (1%).
Self-pay admissions
In contrast, self-pay admissions were down by 3,000 (-4%) in Q2 2023 compared to Q2 in 2022.
Admissions financed by ‘self-pay’ fell in every English region and Scotland (-2%). The biggest percentage fall in England came in the West Midlands (-15%) and the largest fall by volume was in London (-1,190).
Self-pay continued to grow in Northern Ireland (92%) and Wales (17%).
Admissions by English Region by payment method
Admissions by Devolved Nation by payment method
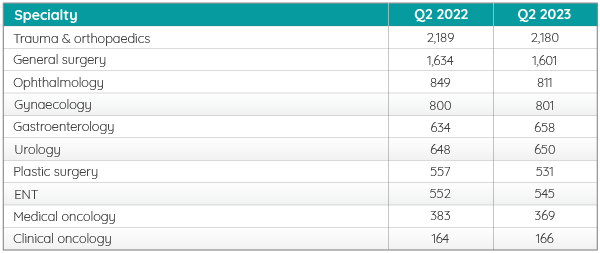
Top 10 procedures*
%20for%20Q2%202022%20with%20Q2%202023%20600px.png)
The biggest increases by volume in admissions in the Top 10 procedures were for diagnostics. ‘Diagnostic Colonoscopy – bowel’ increased by 1,100 (15%) and ‘Diagnostic upper GI endoscopy’ increased by 900 (9%). The next biggest volume increase was in ‘Therapeutic colonoscopy – bowel’ at 700 (21%).
The biggest decrease was in ‘Therapeutics – Chemotherapy’ which reduced by 3,500 admissions (20%). Patients require multiple admissions for chemotherapy.
This pattern is reflected in the Top 10 admissions funded by private medical insurance, but not in those using self-pay. In self-pay there were only minor increases in:
- ‘Diagnostic colonoscopy – bowel’
- ‘Inguinal hernia repair’
- ‘Therapeutic colonoscopy – bowel’
And the remaining procedures either stayed the same (knee arthroscopy and knee replacement) or decreased.
Active consultants in private healthcare
The number of consultants active in private healthcare regularly fluctuates and was down 240 (2%) from Q2 2022 to Q2 2023. However, it was higher in June 2023 than the same month the year before.
Quarterly comparison of active consultants for the top 10 PHIN procedure groups
The largest increase in active consultants in the top 10 procedure groups was in ‘Gastroenterology’ with an extra 24 consultants (4%). The biggest decrease was in ‘Plastic surgery’ where there were 26 fewer consultants (-5%).
Patient demographics
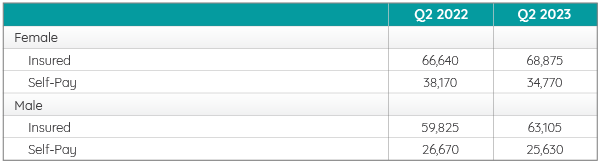
Volume of admissions by sex and payment method
There continued to be more female admissions than male. Both had an increased number of insured admissions and reduction in self-paid admissions compared to the same quarter in 2022.
The drop in self-pay was more pronounced for female admissions at 3,400 (-9%) compared to 1,040 (-4%) for males.
There was also a smaller growth in Insured admissions for females at 2,235 (3%) than males at 3,280 (5%).
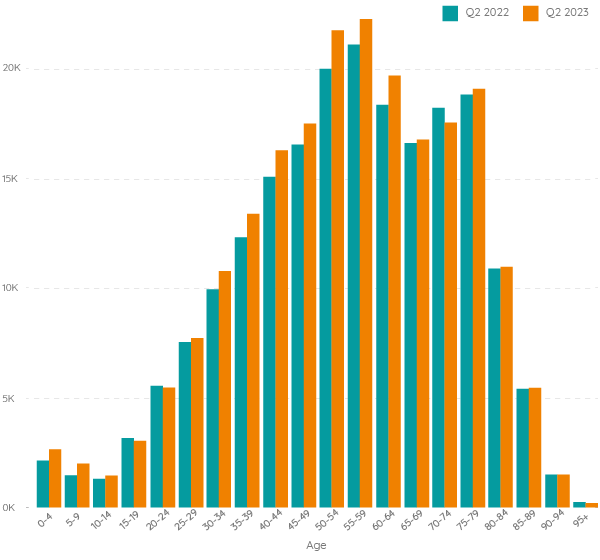
Volume of admissions by age
There was a fall in admissions for the 15-19 and 20-24 age groups, but increases in every other age group (except 70-74, 90-94 and 95+).
Important notes
All data described above taken from PHIN’s unique, national private dataset describing discharge activity (day case and inpatient). This excludes activity outside of PHIN’s mandate from the Competition and Markets Authority, such as outpatient diagnostics and mental health.
There is a time lag between collecting, validating and processing the data we receive from hospitals before we can publish it. This can be up to 6 months after treatment has been completed, to ensure a fair process and accurate data.
Activity numbers have been rounded to the nearest 5, with percentage based on the unrounded figures.