1. Introduction
In this report we quantify and discuss elective cancer care provided in the UK’s independent sector. We use admission data from private providers submitted to PHIN’s Admitted Patient Care (APC) dataset. The dataset encompasses 'inpatient' and 'day-case' admissions and discharges from 1 January 2022 to 30 June 2025.
It describes the scale of cancer, types of tumours, treatment options, and regional patterns. It also includes demographics and methods. These findings can help patients, providers, and policy makers understand how private cancer care delivers services.
We have based this cancer data report on inpatient and day case admissions submitted to PHIN. Counts reflect hospital activity, not unique patients (i.e. the same patients could have been admitted multiple times).
Key points
- Activity: Full year comparisons show that from January 2022– December 2024, the independent sector delivered care for ~273,000 cancer admissions. Including January to June 2025, brings the total to 318,070 admissions. Quarterly volumes are seasonally highest in Q1 and Q4, with overall activity broadly stable (CAGR ˜ -0.2%)
- Tumour mix: Breast cancer remains the largest tumour group, followed by Urological and Haematological cancers. ‘Other’ (incl. secondary/overlapping sites) rose most in absolute volume between 2022 and 2024, while Breast declined modestly.
- Treatment types: Chemotherapy accounts for the largest share of cancer care admissions, followed by external radiotherapy and minor surgical interventions.
- Demographics: There are more female patients being admitted for cancer procedures than males. People in the 50–59 age group have the highest number of private cancer admissions.
- Funding type: The vast majority of admissions are funded through private medical insurance.
- Geography & providers: London shows the largest absolute growth since 2022; the South East has the largest decline. HCA Healthcare remains the largest cancer provider group, ahead of Spire and Nuffield.
Objectives
- Quantify scale and trends in private cancer admissions by year (2022-2024), quarter (Q1 2022-Q2 2025) and tumour group.
- Describe treatment methods (e.g. chemotherapy, surgery, external beam radiotherapy) seen in admissions and explain data coverage limitations.
- Profile distribution by region and provider group, highlighting areas of growth or decline.
- Summarise demographics to understand who uses private cancer care.
- Explain caveats and methodological choices to ensure that readers can interpret findings correctly.
Scope
Included: Day case and inpatient admissions for patients with a primary malignant cancer diagnosis. Discharge dates from 1 Jan 2022 to 30 Jun 2025. Insured and self-pay privately funded care.
Excluded: All 'outpatient' care (e.g. most external beam radiotherapy), mental health, and diagnostics.
2. Overall activity trends
Total admissions by year (2022–2024)
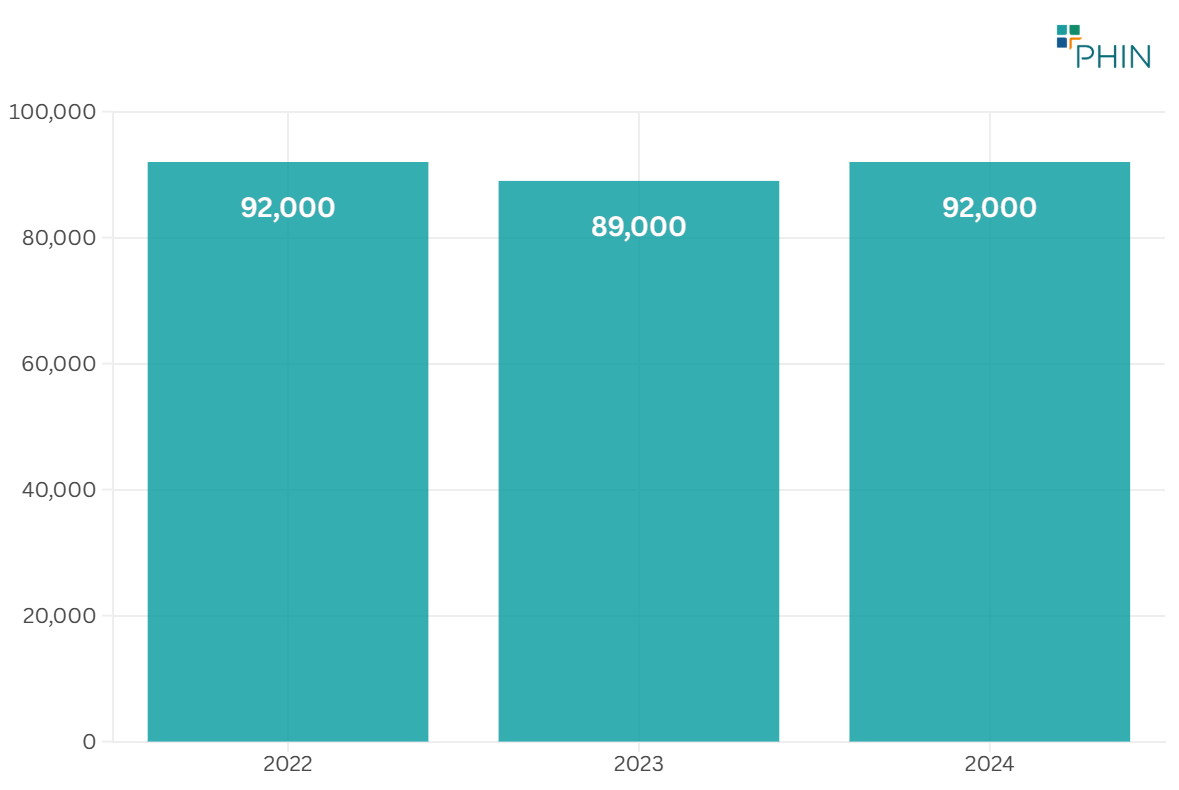
Between 2022 and 2024 there were 273,000 private admissions with a primary cancer diagnosis in the UK (see Figure 1).
Total admissions by quarter (Q1 2022 – Q2 2025)
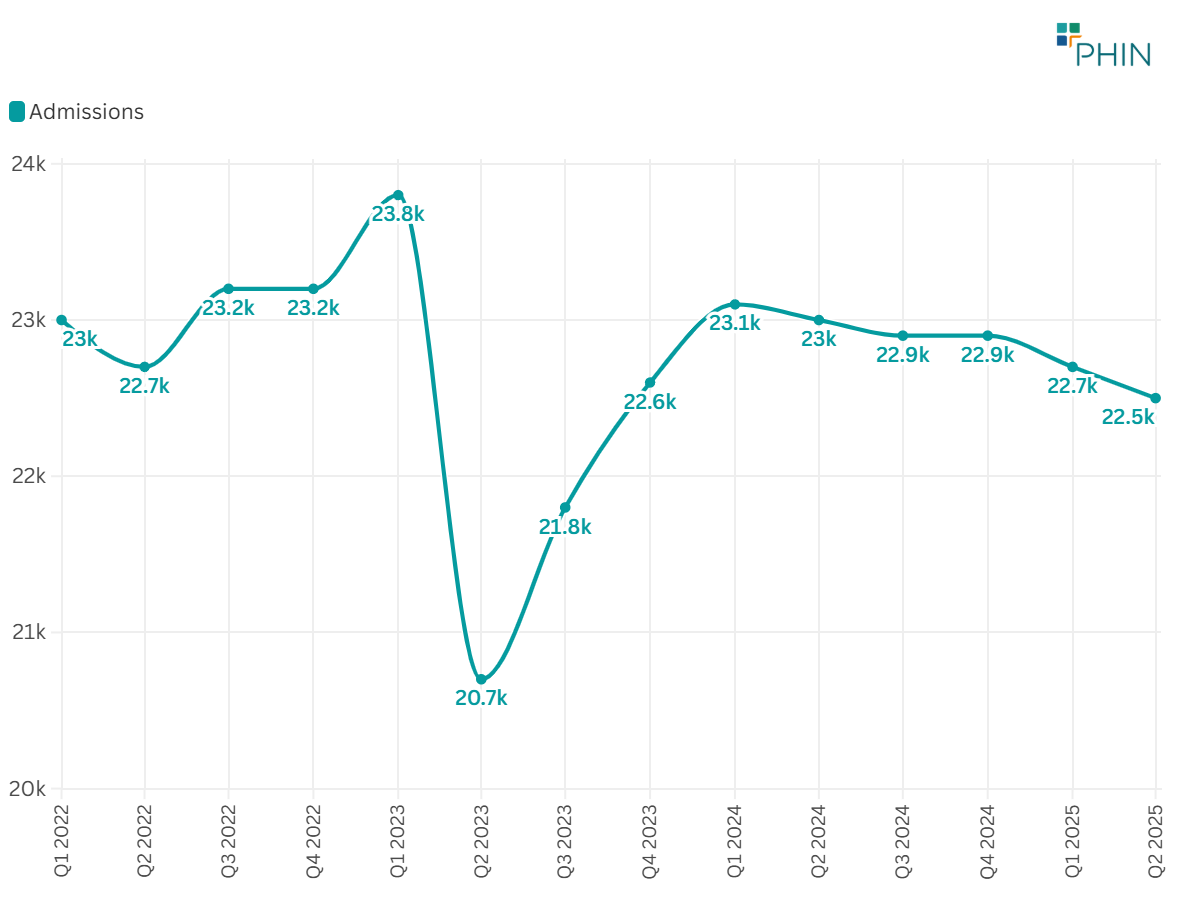
Private admissions ranged between 20,700 and 23,800 between Q1 2022 and Q2 2025 (see Figure 2).
Seasonal variance
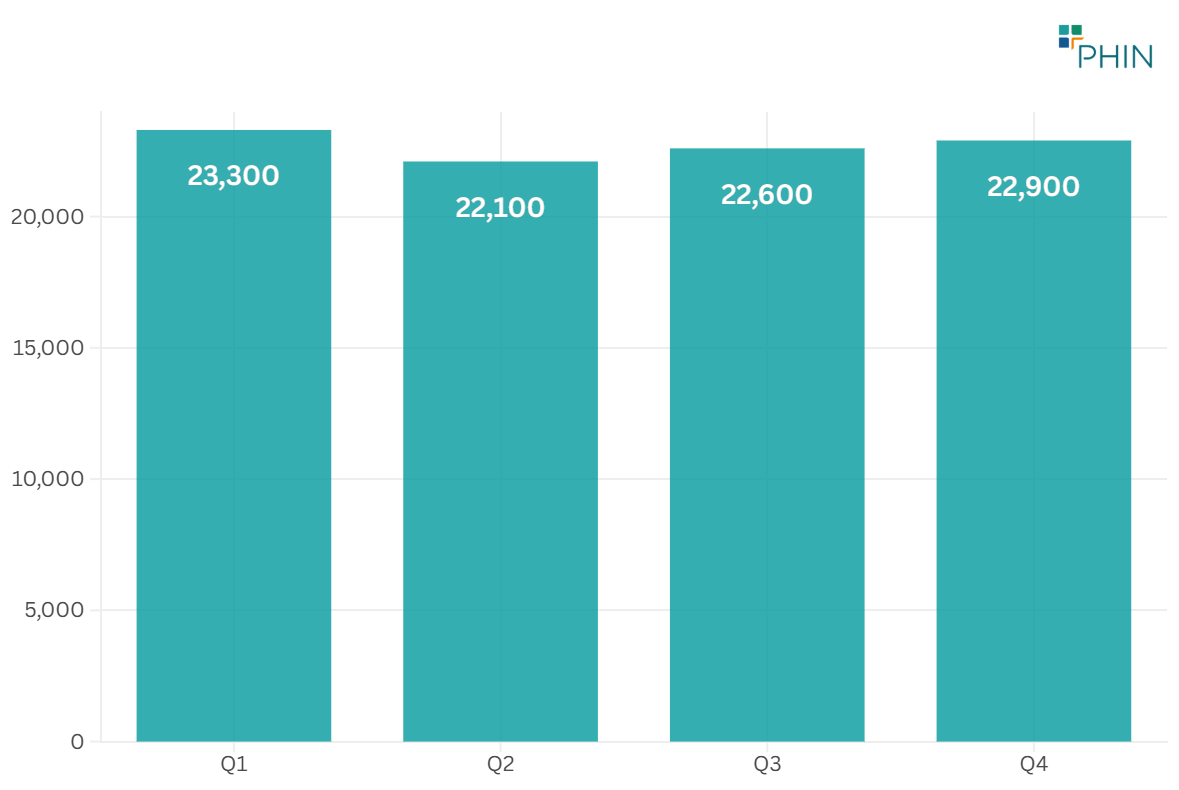
In the UK, private cancer admissions were highest in the first quarter when they averaged 23,300 admissions. The fourth quarter also had high numbers, averaging 22,910 admissions. This mirrors the trends for private hospital admissions for all procedures with peaks at the beginning and end of the year.
Growth or decline patterns
Private admissions had a small decline of -0.2% (CAGR) from Q1 2022 to Q2 2025, based on quarterly totals.
Q2 2023 saw a 13% volume decrease (see Figure 4). This is mainly because there were fewer breast cancer admissions.
3. Analysis by cancer type
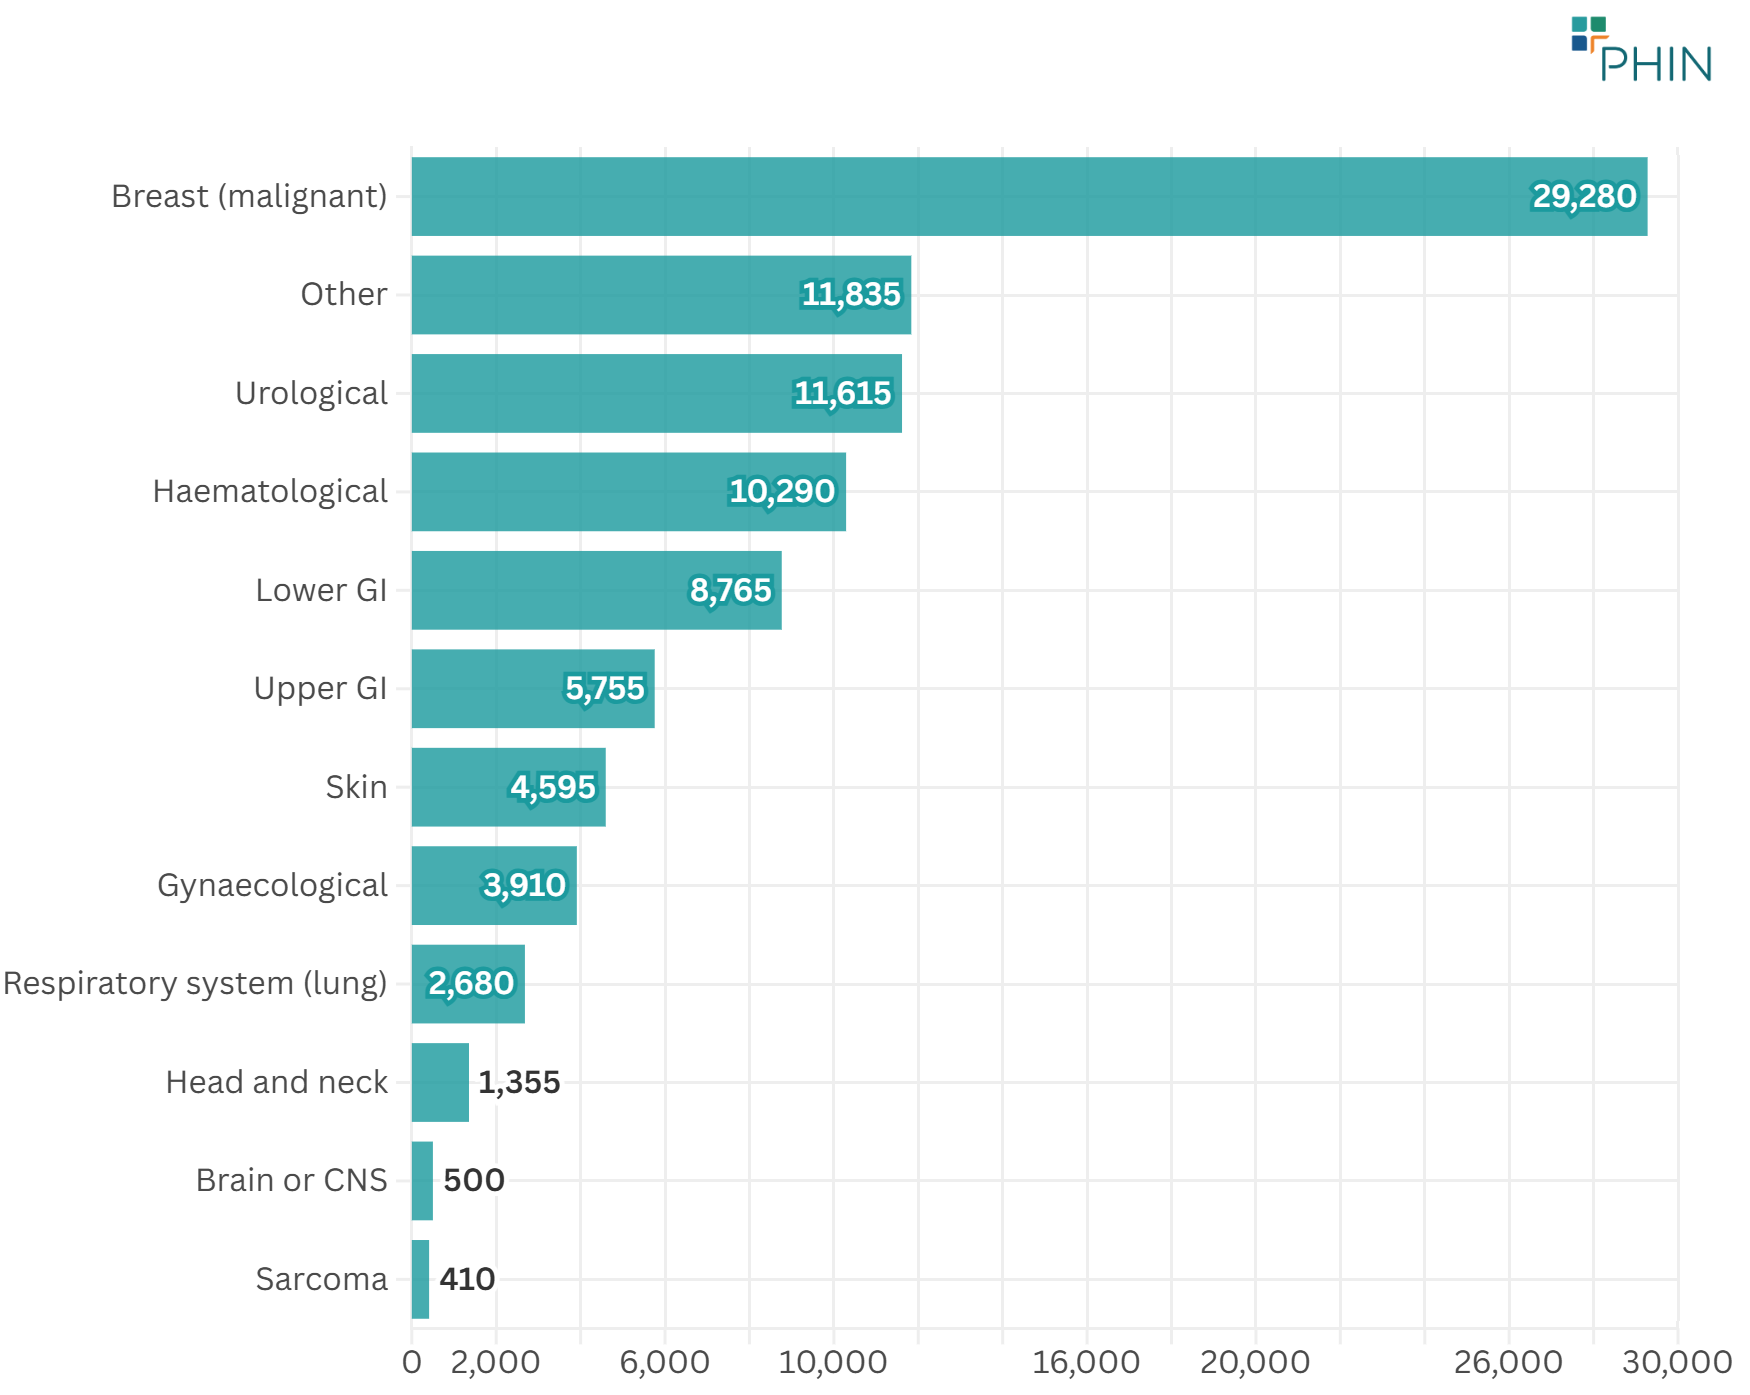
Breast cancer is the most common type of the disease. Urological cancers, such as prostate and bladder cancer, come next, with blood (haematological) cancers also reasonably high (see Figure 5).
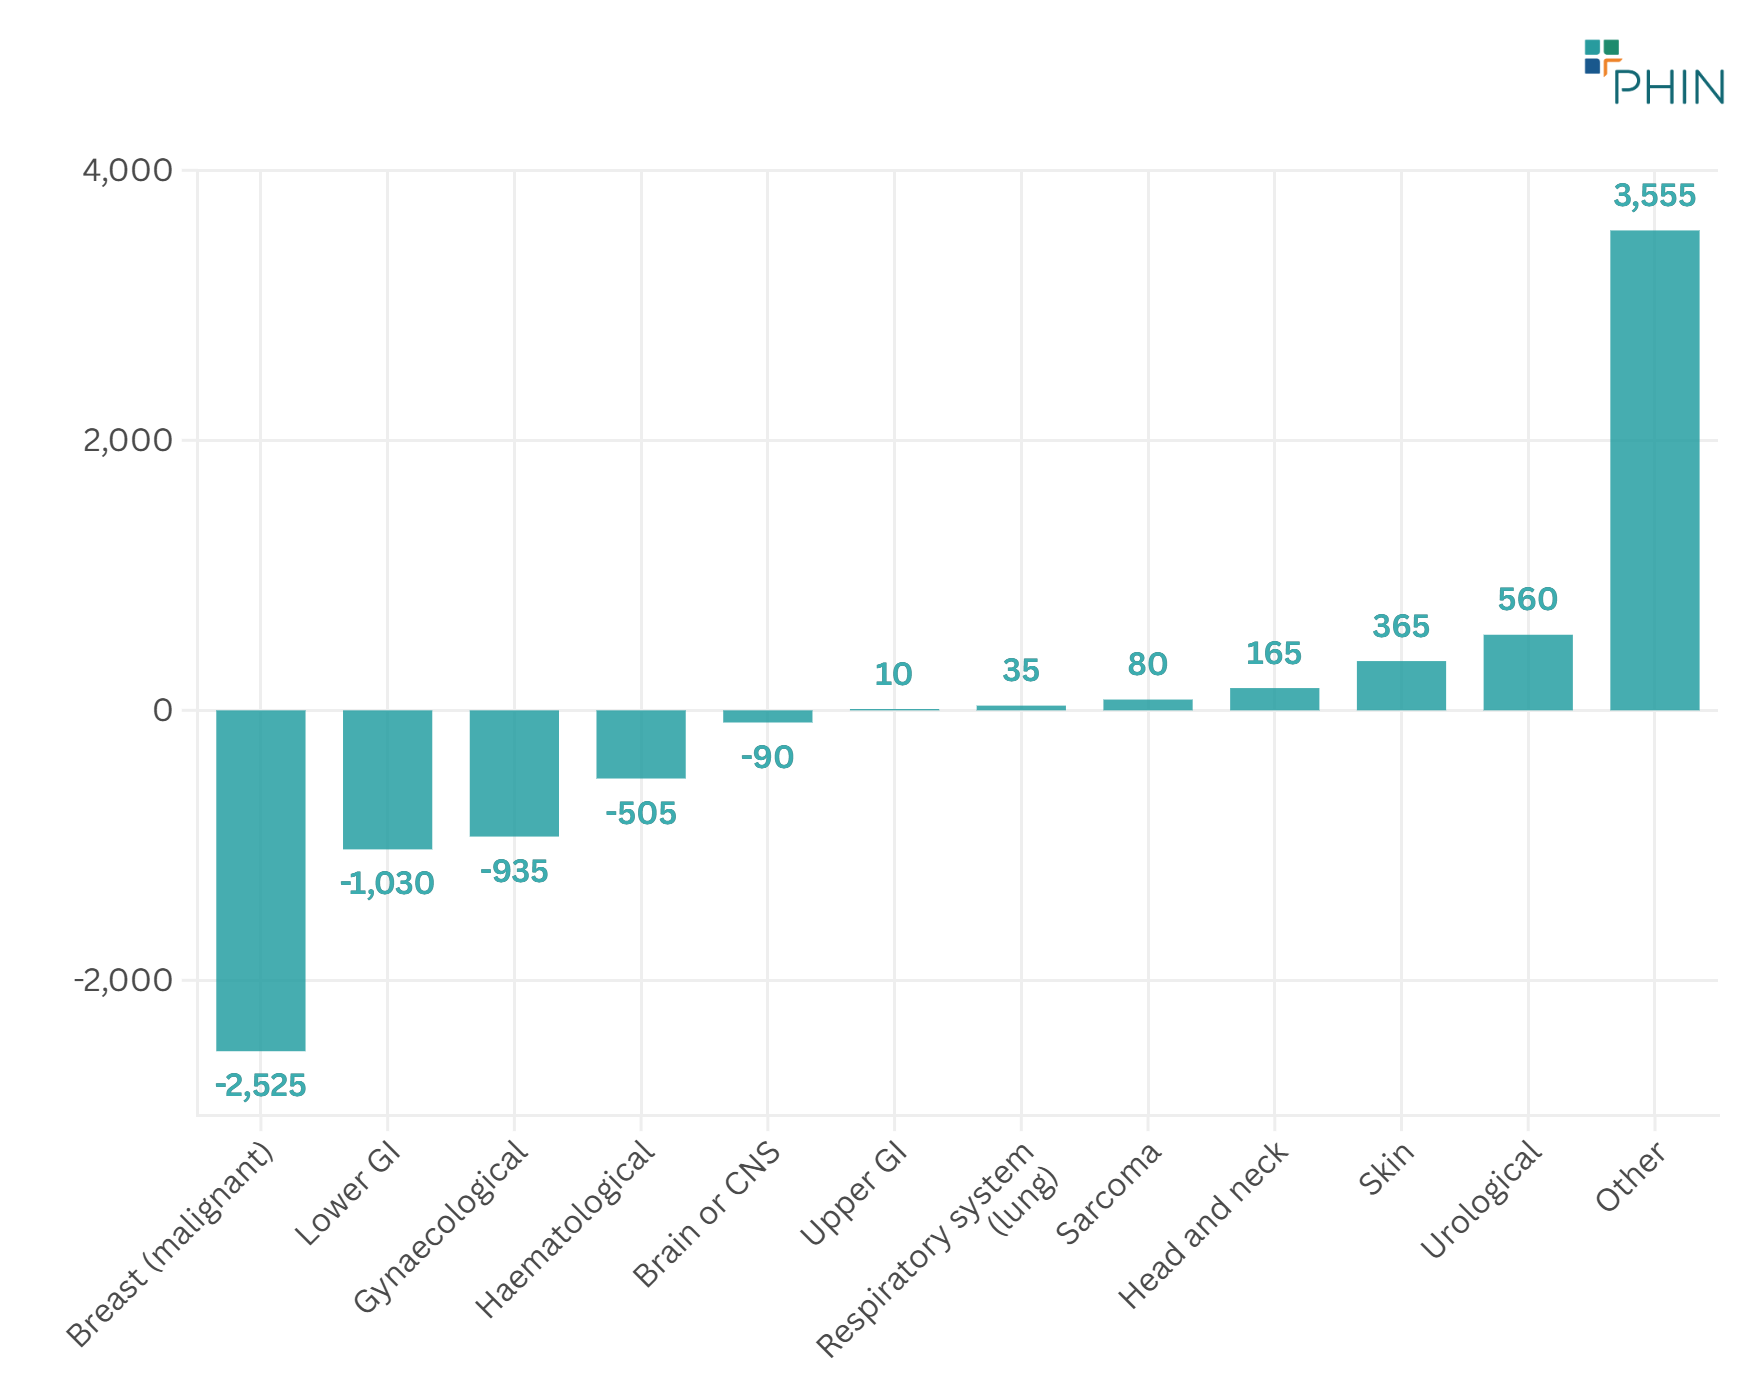
Between 2022 and 2024, 'Other' – covering secondary cancers and overlapping sites – showed the largest volume increase. Breast cancer showed the largest volume decrease (see Figure 6).
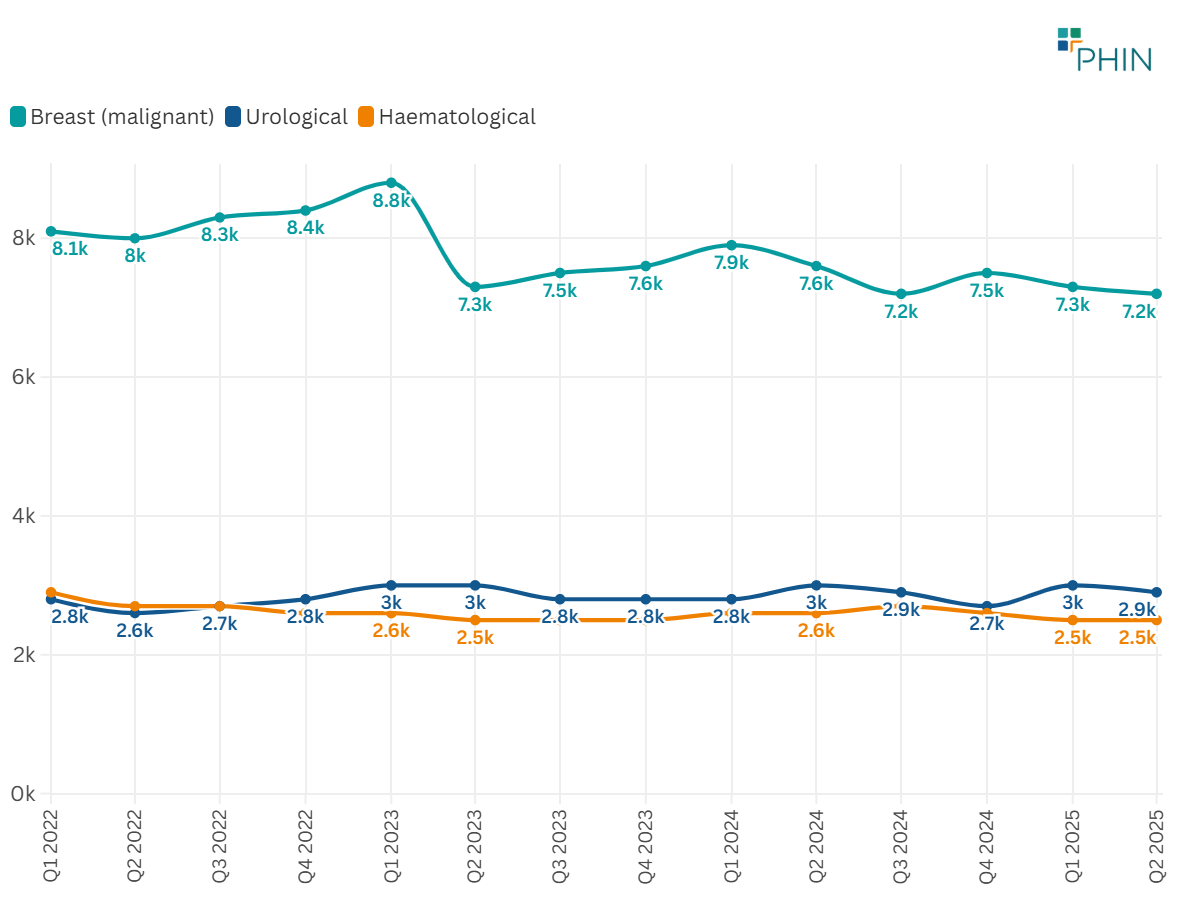
For the cancer types with the most admissions, Breast cancer shows a downward trend. Urology and Haematological admissions remain stable (see Figure 7).
4. Treatment methods
Chemotherapy is overwhelmingly the most common admission type among private cancer admissions (see Table 1). Note that single patients may have multiple chemotherapy admissions.
Table 1: Top 10 interventions for all cancer types (Q1 2022-Q2 2025)
| Procedure | Admissions | % of total cancer admissions |
|---|---|---|
| Chemotherapy | 202,215 | 64% |
| Medical admission (no procedure undertaken) | 12,940 | 4% |
| External radiotherapy | 11,130 | 4% |
| Skin lesion removal | 7,890 | 2% |
| Intravenous drug infusion | 7,460 | 2% |
| Wide local excision (breast) | 5,205 | 2% |
| Vascular port insertion | 4,735 | 1% |
| Prostate needle biopsy | 4,110 | 1% |
| Mastectomy | 3,700 | 1% |
| Robotic assisted prostatectomy | 3,540 | 1% |
Chemotherapy
The highest admissions for chemotherapy are for:
- Breast cancer
- Blood cancer
- Colorectal cancer
This report only includes inpatient and day-case admissions. Therefore, the number of radiotherapy sessions does not show those delivered in outpatient settings across the UK.
5. Demographic insights
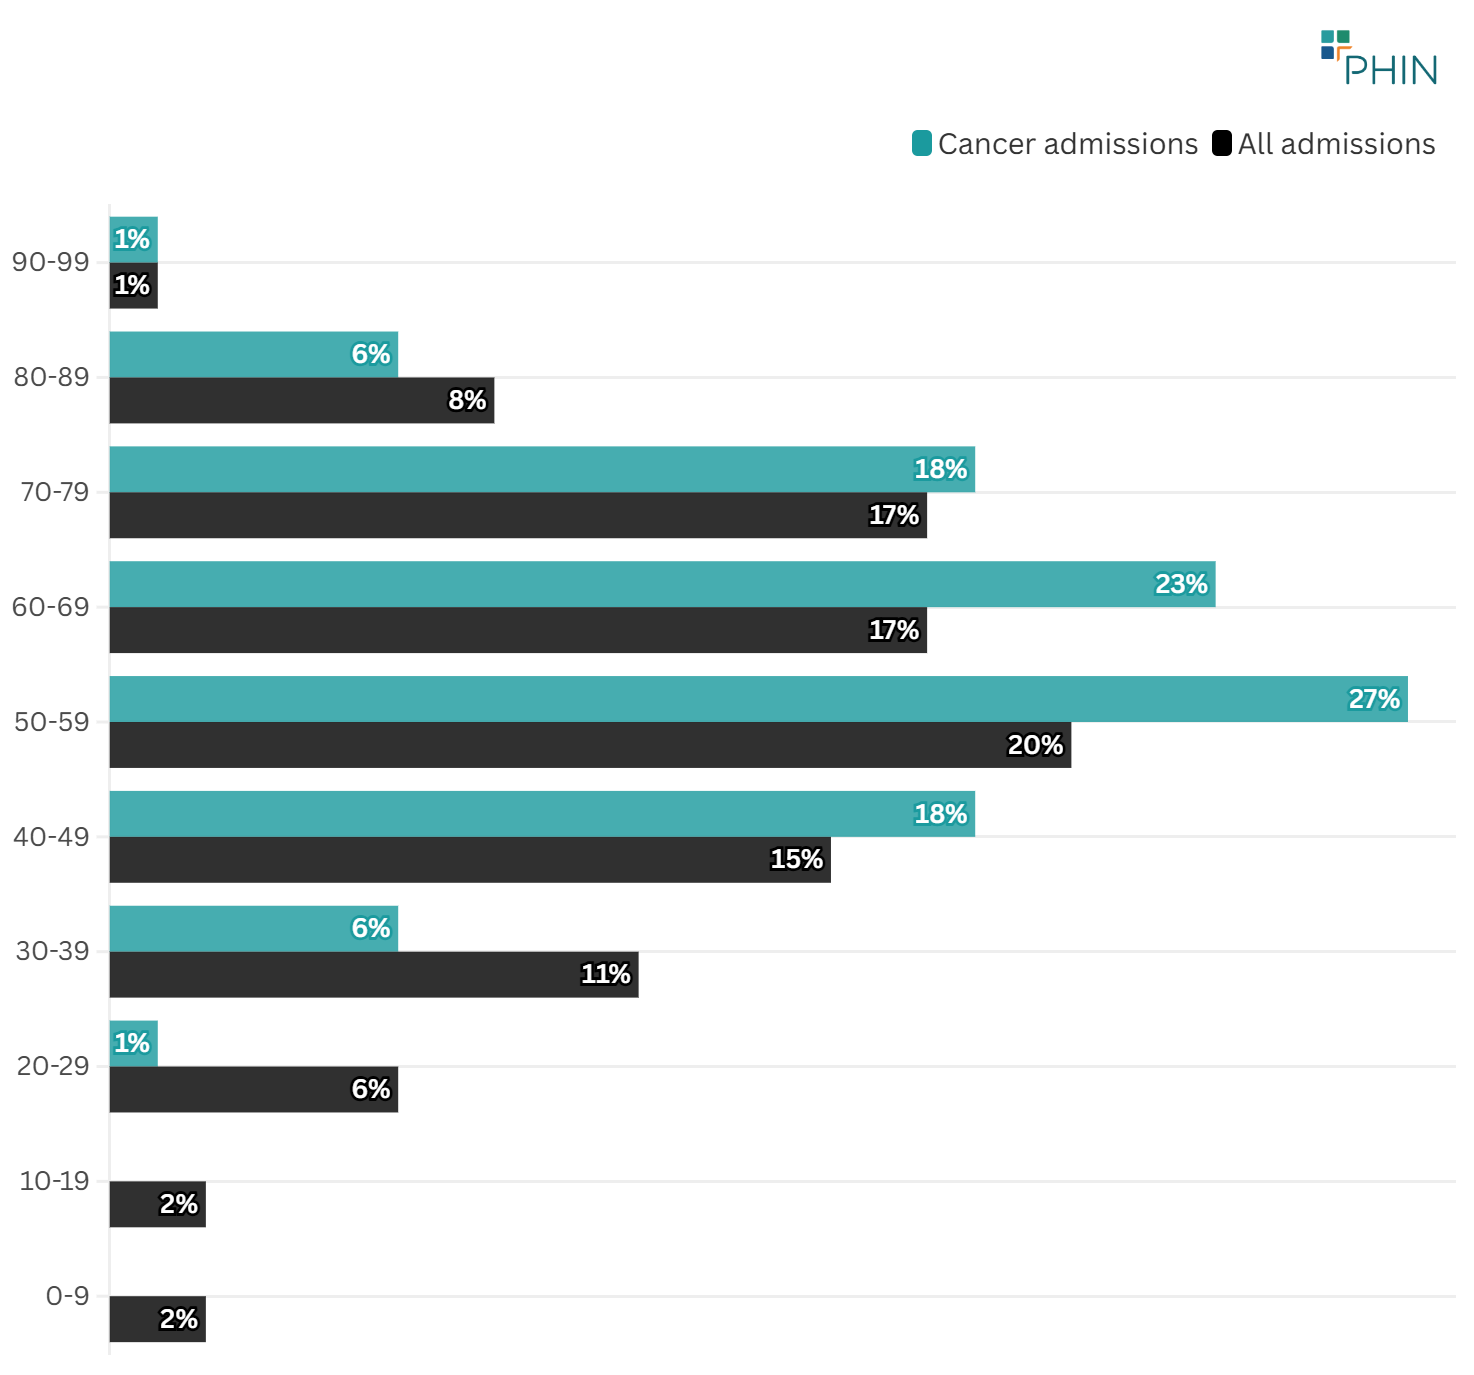
Individuals aged 50–59 comprised the largest proportion of total cancer admissions. This age distribution mirrors that of all national private admissions. However, there is a higher proportion of admissions in the 50–69 age group for cancer than for all admissions (see Figure 8).
From 2022 to 2024, the 40–49 age group had the most significant increase in patient admissions (an additional 1,400). The 70–79 group experienced the largest decline (a decrease of 460 admissions).
6. Regional and provider-level analysis
The three regions with the highest number of admissions for cancer care are London, the South East and East of England.
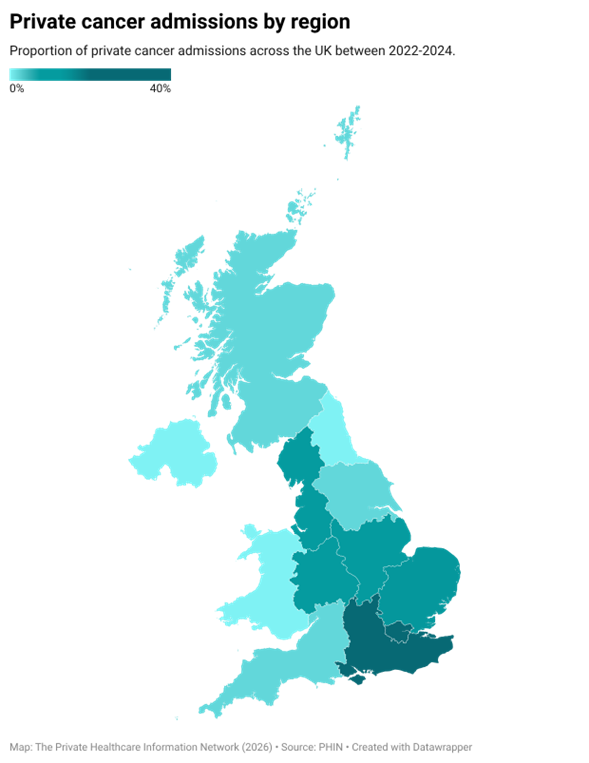
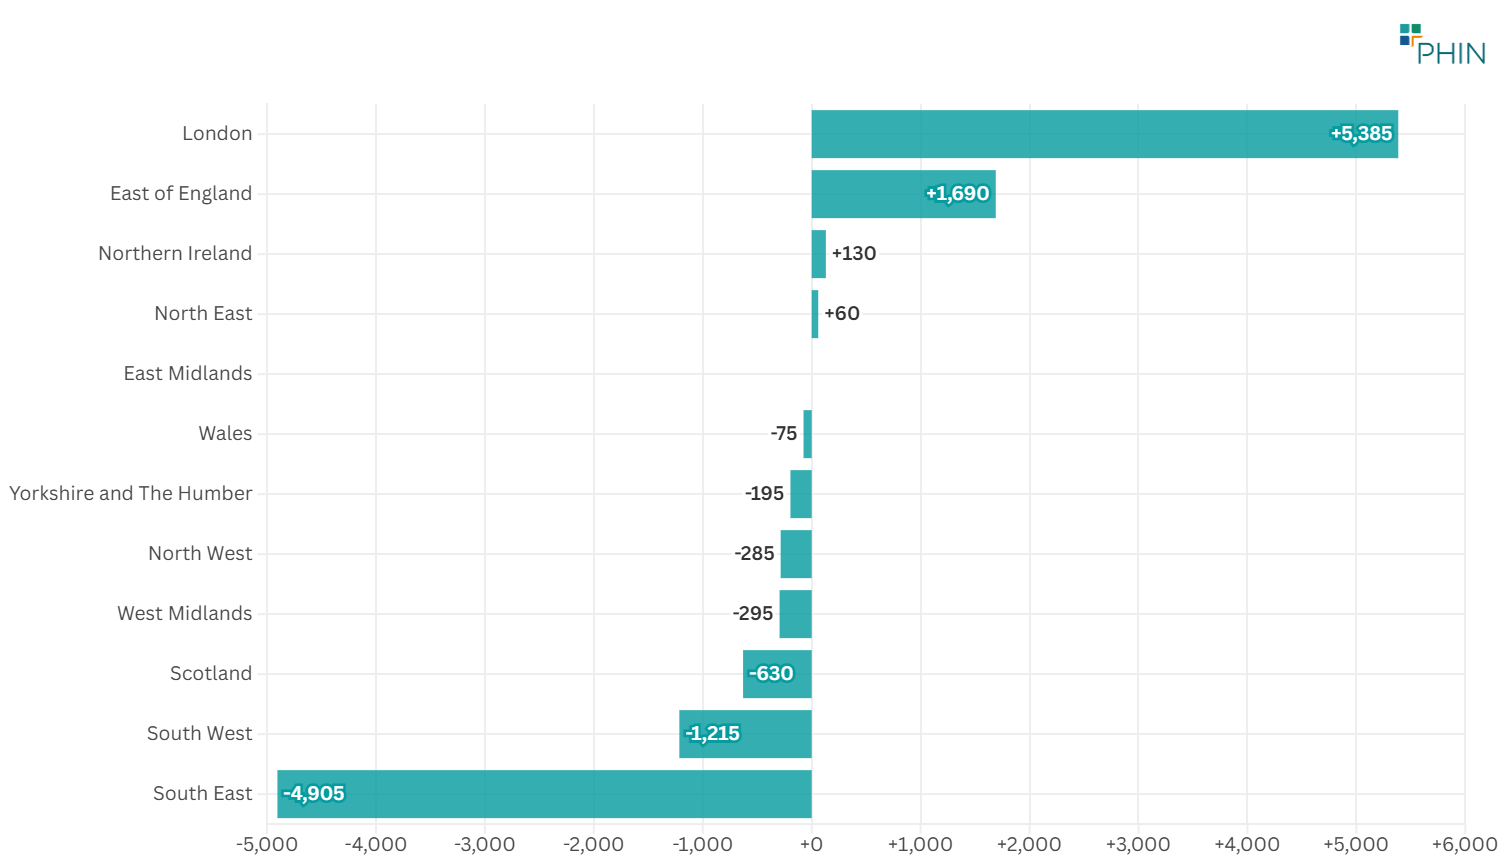
Of these regions, London had the highest increase in cancer admissions (see Figure 10). The region with the largest decrease in cancer admissions is the South East.
Northern Ireland was the only devolved nation that saw an increase in admissions (+130) during the same period.
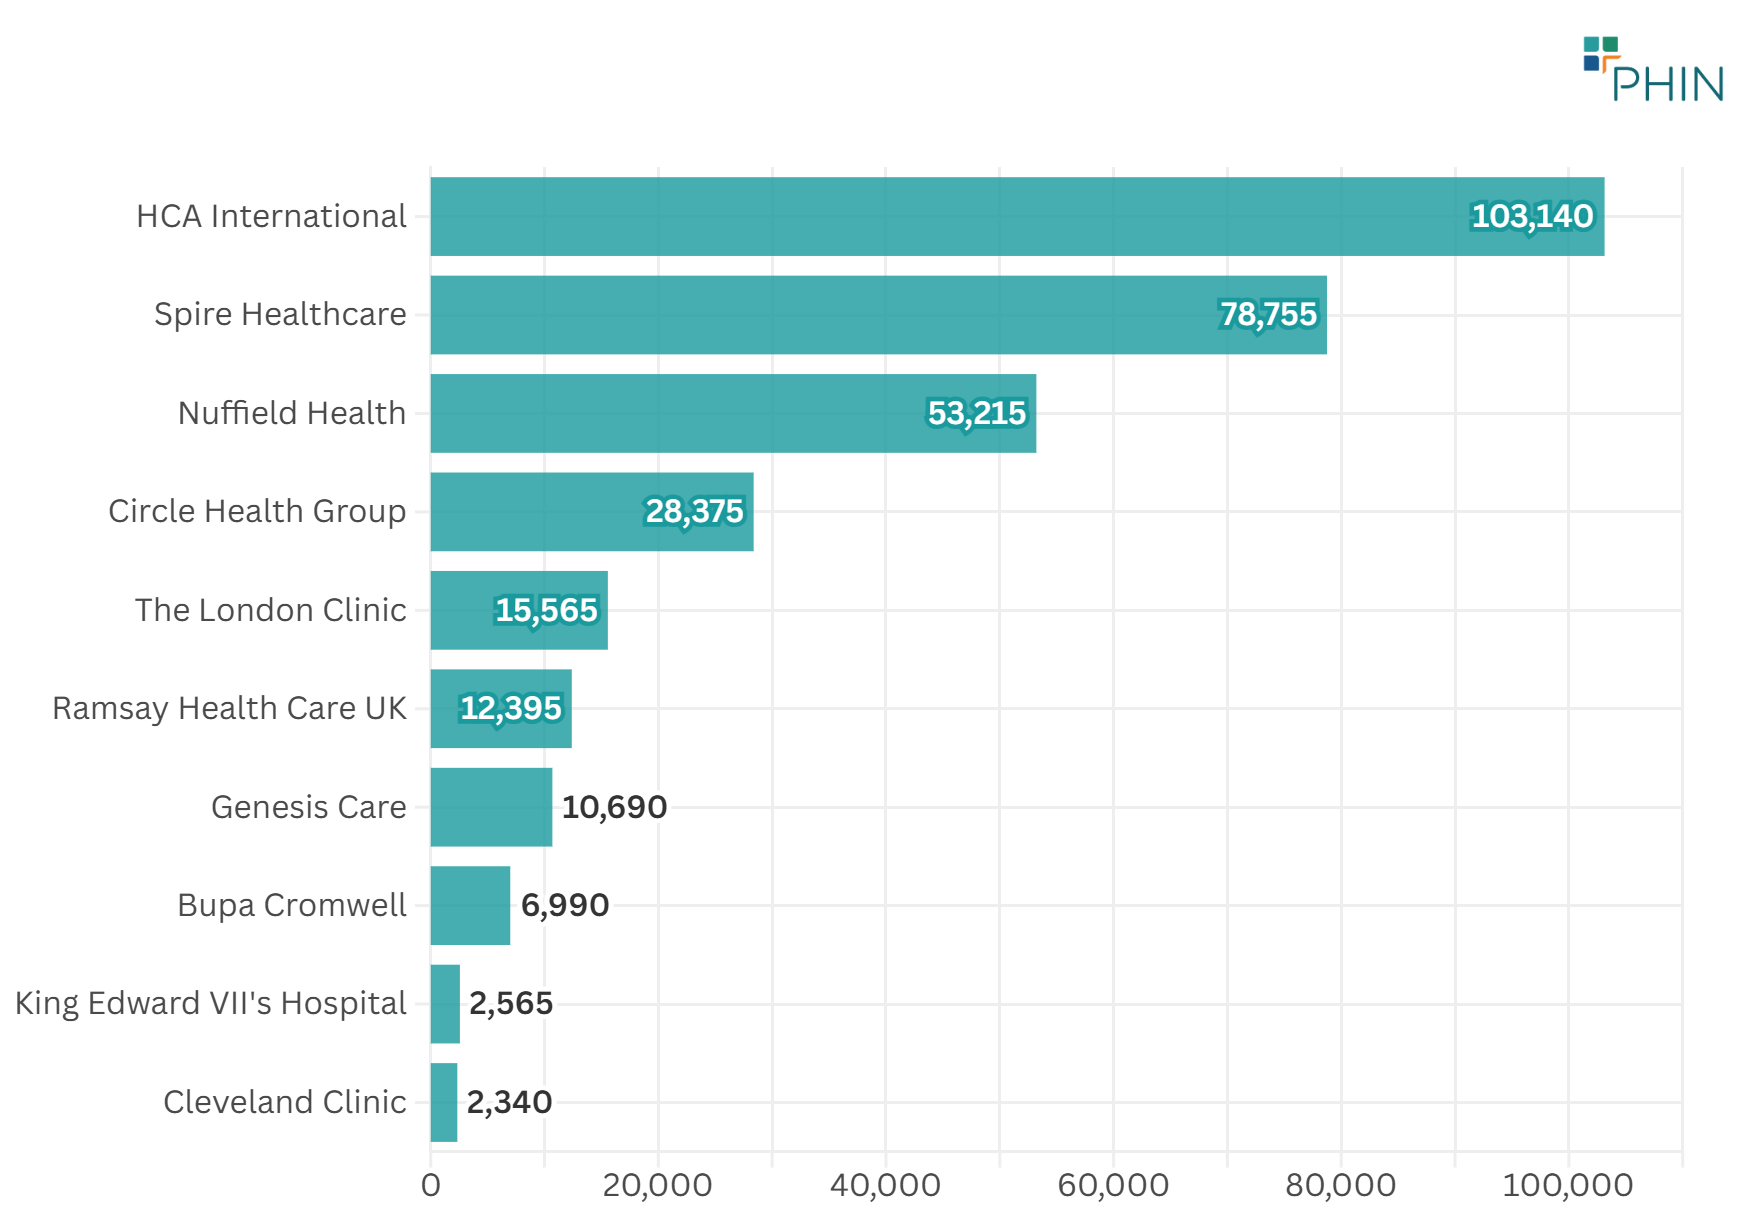
HCA Healthcare UK provides the most elective inpatient cancer care in the UK, followed by Spire Healthcare and Nuffield Health.
7. Discussion
Scale and trends
Between 2022–2024, the independent sector delivered ~273,000 cancer admissions; across Q1 2022–Q2 2025, there were 318,070 admissions.
Quarterly volumes show the expected seasonality (peaks in Q1 and Q4) and overall stability (CAGR ˜ -0.2%). A temporary dip occurred in Q2 2023, largely reflecting reduced Breast admissions, followed by an increase.
Tumour-site mix
Breast remains the largest tumour group, followed by Urological and blood (Haematological) cancers.
Between 2022 and 2024, ‘Other cancers’ (including secondary and overlapping sites) shows the greatest absolute increase. Breast cancer shows a modest decline.
This pattern likely reflects the treatment options available. These include outpatient therapy and shared care for breast cancer. It also reflects more coding for overlapping cancer sites.
Treatment types
Chemotherapy is the most common admission type, consistent with multi cycle systemic therapy generating repeated inpatient/day case episodes.
External beam radiotherapy ranks third in admissions. Most of these treatments occur in an outpatient setting. Therefore, the data in this report does not fully show how popular this procedure is.
Surgical activity (e.g., wide local excision, mastectomy, robotic prostatectomy) remains significant, albeit smaller in episode volume than chemotherapy.
Geography
Independent sector cancer care appears stable with London led growth. London has seen the biggest rise in cancer admissions since 2022, while the South East has had the largest drop.
Although London leads in overall private cancer activity, the South East holds the second-largest share at 20%. Admissions declined in every UK nation and region except London and the East of England.
Provider landscape
At group level, HCA Healthcare has the highest cancer admission volumes, followed by Spire Healthcare and Nuffield Health. This concentration is consistent with oncology services (medical oncology, complex surgery) and London centric demand.
Market developments may further increase capacity and patient choice in central London. In July 2025, Cleveland Clinic London announced a new cancer centre at 40 Grosvenor Place. It expects that will be finished by the end of 2027.
Demographics
Cancer admissions are concentrated in ages 50–69, with the most admissions in the 50–59 age band. This pattern broadly aligned with all admissions but over represented in the cancer cohort. Over time, ages 40–49 had the highest increase by volume; 70–79 declined modestly.
Female patients make up the majority (62%) of cancer admissions.
Payment type
A very high proportion (93%) of admissions are funded by private medical insurance. This is well above the average for all admissions which is 70%, with the remainder being funded by ‘self-pay’.
8. Conclusion
Private cancer care in the UK is substantial and stable. The private sector delivered hundreds of thousands of admissions from 2022–2025 with predictable seasonal variations. Breast is the largest tumour group though declining modestly; ‘Other’ admissions have risen.
Chemotherapy dominates admissions. This is consistent with the repeated systemic therapy episodes often required. Radiotherapy activity is not well-represented, because it happens in outpatient settings, and data is not sent to PHIN.
There are more admissions for female patients than male ones. This could reflect the fact that breast cancer awareness is higher, or that there are more female patients for total admissions.
Given the high proportion of admissions funded by private medical insurance, it would appear people are planning ahead for potential cancer treatment and ensuring it is covered in their policy.
London drives growth, and activity is concentrated among a few large provider groups.
9. Appendices
Method and caveats
This analysis includes private day case and inpatient spells with discharge dates from 1 Jan 2022 to 30 Jun 2025, where the primary diagnosis is within International Classification of Diseases (ICD 10) C00–C97 (malignant neoplasms).
Counts are episodes (not unique patients); systemic therapies can involve multiple admissions per patient. Cancer categories follow National Disease Registration Service (NDRS) site groupings.
Chemotherapy is identified using OPCS Classification of Interventions and Procedures (OPCS-4) X352, X373, X384, X70–X74. Sub national figures are subject to SDC (1–7 suppressed).
All counts are rounded to the nearest 5 and sub-totals may not add to totals.
Provider counts are aggregated at hospital-group level including day-case and inpatient admissions for a primary cancer diagnosis.
Where growth is specified, Compound Annual Growth Rate (CAGR) is used based on quarterly counts.
Limitations
PHIN gathers and reports data solely on day-case and inpatient admissions; it does not collect outpatient data. As most external beam radiotherapy is provided in outpatient settings, its coverage in this dataset is lower than expected.
10. Authors
QA Analyst: Ashwani Sharma
Clinical Advisor: Dr Chris Smith-Brown
Communications Lead: Alistair Moses
The Private Healthcare Information Network (PHIN). Copyright 2026.
