PHIN publishes data on the impact on Covid-19 on private healthcare.
New data on private healthcare in the UK shows how the Covid-19 pandemic has led to an estimated 84% drop in privately funded care.
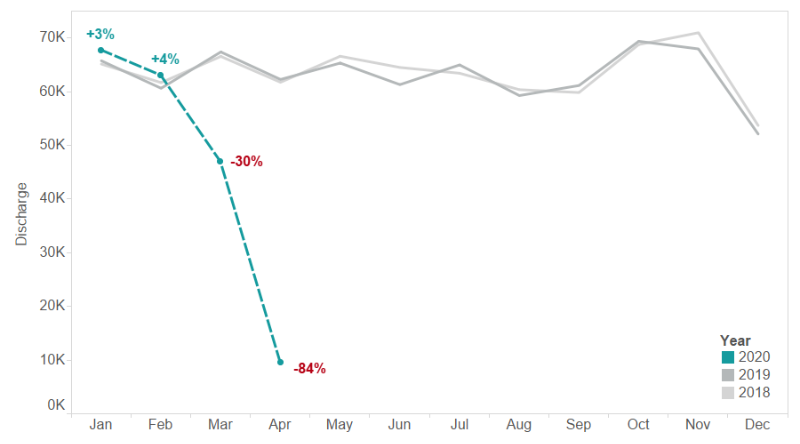
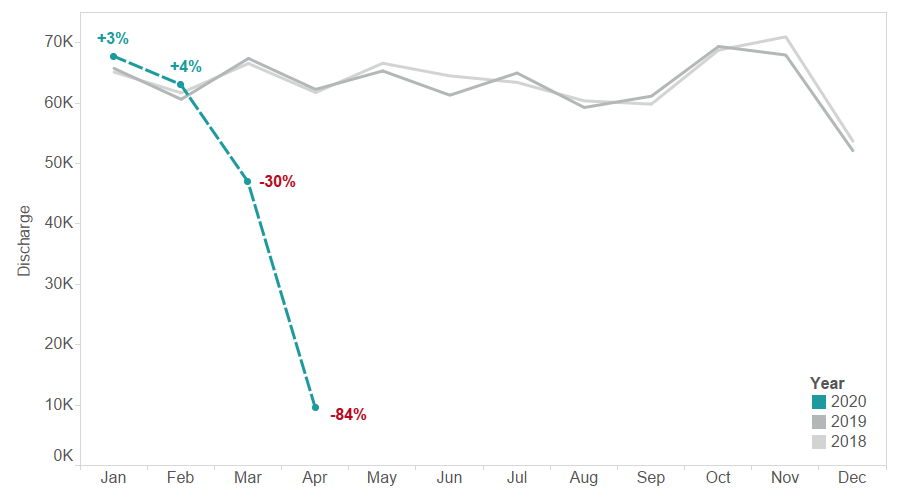
Following a slight rise in the estimated number of overall privately funded episodes of care of 3% in January 2020 and 4% in February 2020 respectively, in March the data shows an estimated drop of 30% compared with 2019, and an estimated 84% drop between April 2019 and April 2020. [1]
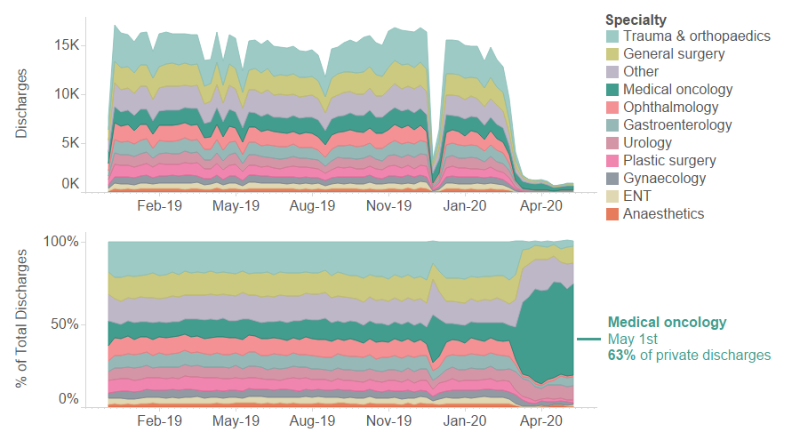
The type of private treatments delivered during the pandemic has also changed significantly, with medical oncology becoming the largest single specialty performed, making up an estimated 63% of all privately funded admissions in May 2020. [2]
These insights are based on PHIN’s national private healthcare dataset, and look at how the nature of privately funded care changed as the country went into lockdown and independent hospitals and NHS Private Patient Units diverted their resources to support the NHS.
Dr Jon Fistein, PHIN’s Chief Medical Officer, said:
“While the impact on privately funded care is still emerging, with some the underlying data still incomplete, we can start to picture of the impact Covid-19 has had on the private healthcare market in the UK.
“As hospitals have diverted their resources to support the NHS effort private care took a back seat. It is reassuring to see that urgent care – such as medical oncology – has continued to be provided during the difficult time. We will be keeping an eye on the situation and what happens over the coming weeks and months.”
Dr Jon Fistein, PHIN’s Chief Medical Officer
The analysis was launched in PHIN’s new Quarterly Digest – a new newsletter with insights from PHIN’s data, updated from PHIN’s work, and expert opinions.
Notes to editors
[1] Estimated count of private episodes

Footnote: YoY change are calculated using sites with confirmed volumes for 2020 and 2019 for each month, removing influence of delay in private data submissions due to Coronavirus. 2020 volumes are estimated based on sites with confirmed activity. Estimates assume these sites are representative of the entire market, with confidence varying depending on number of submitting sites.
- Typical sites submitting per month: 400
- January 2020: 236 Sites
- Feb 2020: 228 Sites
- March 2020: 167 Sites
- April 2020: 75 Sites
[2] Private activity by specialty as % admissions

Footnote: Recent share is based upon only sites that have submitted data more recently, however the make-up of these providers is generally representative of the entire market. Whilst medical oncology represents a greater proportion of activity than seen historically, this may be influenced by larger variations caused by smaller number of discharges.
All data, statistics and graphs ©PHIN 2020, all rights reserved. The accuracy of information presented is dependent on the completeness and quality of data supplied by private hospital operators, and may be corrected or updated in future. PHIN accepts no liability for the accuracy of the information. Not to be reused in whole or in part without permission and attribution to PHIN.
