PHIN publishes information on ‘volume’ to show how often hospitals and consultant doctors carry out particular procedures. Volume is simply a count of activity, based on patient spells and consultant episodes. While volume on its own does not show quality or safety, it can help build a picture of experience when viewed alongside other published measures such as length of stay and patient outcomes. This information is published in downloadable datasheets for hospitals and consultants and is designed to support more informed choices and conversations about care.
What is ‘Volume’ and why should I be interested in this information?
There are two aspects that make up the ‘volume’ of patients treated at a hospital or by a consultant:
- ‘Spells’ – a continuous period of time spent within a hospital as a patient. This time is counted as a single event. This can give an indication of the number of patients treated at a hospital site.
- Finished Consultant ‘Episodes’ – defines the time spent with one consultant while in hospital. Therefore, if a patient is moved under the care of a different consultant, a new episode begins. A patient can have multiple episodes under a single spell. Each episode in a spell is counted and offers a more thorough representation of activity provided by hospitals and consultants.
Although evidence showing direct relationships between increasing volume of cases and improved health outcomes is variable, it is reasonable to assume that the more times a hospital or consultant undertakes a particular operation, the more experience and expertise they will have.
This information, in combination with other measures that PHIN also publishes, may be used to seek out safer treatment and better outcomes.
We publish episode and spell (volume) information for both consultants and hospitals in Excel files showing:
For consultants
- Volume by Consultant – See the tabs for ‘Volume by Consultant’ and ‘Volume by Consultant and Procedure’.
For hospitals
- Volume by Nation – See the tabs for ‘Volume by Nation’ and ‘Volume by Nation by Procedure’.
- Volume by Hospital Site – See the tabs for ‘Vol by Site’ and ‘Vol by Site and Proc’.
Each of these reports on the latest year to date (e.g. 1 Apr 2022 to 31 March 2023).
Using volume information won’t reveal the quality and safety of a hospital/consultant unless viewed and combined with other information, such as ‘Length of Stay’. For example, if a consultant has treated a very high number of patients, their average length of stay is likely to be more reflective of a typical patient in their care.
Before publishing data...
There are several rules and caveats associated with the Admitted Patient Care (APC) data being collected that we consider before publishing Volume measures on our website.
The Volume measures we publish are compliant with data protection and privacy laws and PHIN uses ‘small number disclosure controls’ (SDC) rules where appropriate. This minimises the risk of individuals being identified. Counts with values between 1 and 7 (inclusive) aren’t published and a ‘*’ symbol is added instead. Values of 0 are displayed where applicable and all other values are rounded to the nearest multiple of 5.
A step-by-step guide to accessing volume information
To view the information, you need to:
- Go to the Volume and Length of Stay datasheets in the Our Data section of the PHIN website
- Click on the link to download the Excel file for either hospitals or consultants (see example below):
You should then get a pop up to click on, or you can go to your downloads folder and open the file from there.
In the Consultant Volume and Length of Stay Excel file you can view:
- Volume by Consultant
Volume by Consultant (the ‘Vol by Consultant’ tab) tells you the total number of episodes and spells a consultant has managed.

This may include NHS information, giving you a fuller picture of the consultant’s overall work, but does not tell you about the specific procedure you may be planning to undergo.
In the example below, each of the three consultants were with the patient for the complete spell (so there isn’t a separate count for episodes) and no NHS data was submitted. The consultant in the top row has had more patient spells (530) so may be more experienced.

Volume by Consultant and Procedure (the ‘Vol by Consultant and Proc’) tab allows you to see how many of an individual procedure the consultant has conducted.

Again, this may include NHS procedures as well as those in the independent sector.
In the example below, you can see how many of a particular procedure a consultant has conducted and how they are split between the independent sector and the NHS. This can give you an insight into the consultant’s experience at a particular procedure.
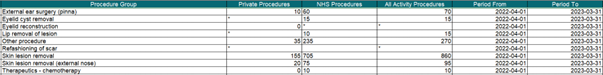
In each example the consultant’s name would be in a column further to the left.
In the Hospital Volume and Length of Stay Excel file you can view:
- Volume by Nation
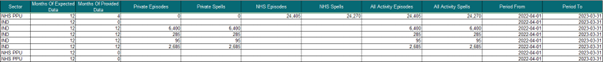
Volume by Nation (‘Vol by Nation’ tab) shows the total number of private episodes and spells (and for England the NHS episodes and spells) in each nation of the UK.

This gives you an idea of the overall activity in each country.

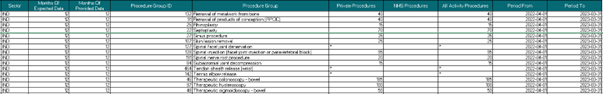
Volume by Nation and Procedure (Vol by Nation by Proc tab), breaks down the number of times a different procedure has been conducted in the UK as a whole, and then by country (England, Northern Ireland, Scotland and Wales).

This can show you whether a country does proportionally more or less of a procedure.

- Volume by Hospital Site

This includes the sector i.e. whether it is an independent site (IND) or NHS private patient unit (PPU), as well as the number of months for which we expect data to have been provided.
If the data has not been supplied, you may wish to ask the hospital why. Where it has been you can use this to see how many overall procedures a hospital conducts.
Volume by Site and Procedure (‘Vol by site and Proc’) shows you how many of a particular procedure have been conducted at an individual hospital site.

This can include private and NHS procedures.
In each example the hospital site name would be in a column further to the left.
Help with understanding and using our healthcare datasheets
Find out more about our data sheets, including how we protect patient data.
Back to Datasheets .
